
Temperatures in the capital of Greenland have been the coldest on record, and they are still buried in snow. Temperatures have plummeted over the past decade.
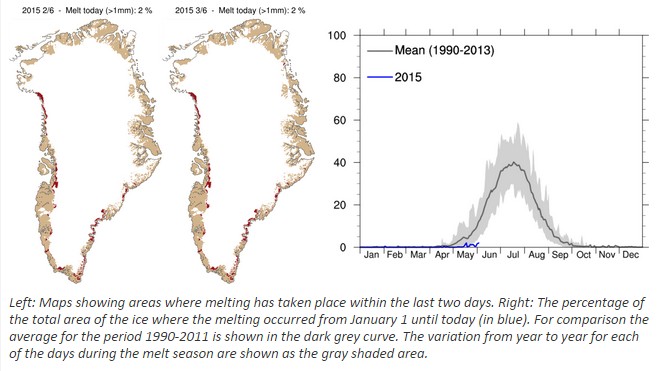
Normally by this date, around 20% of Greenland is melting. This year the area of melt is less than 2% – the latest start to a melt season on record.
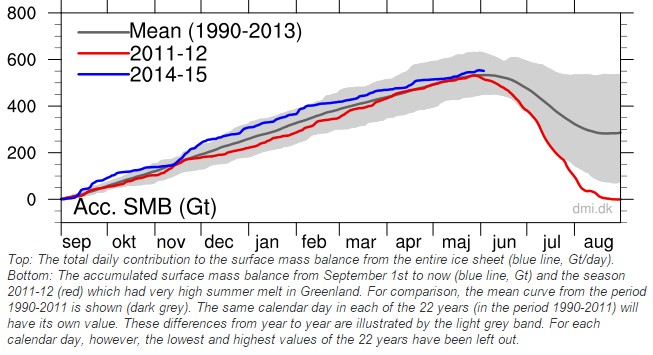
Greenland has gained half a trillion tons of snow and ice since September. This all has to melt in the air or flow into the sea and melt – in order to keep equilibrium of the ice sheet.
Look for climate experts to take pictures of glaciers calving into the ocean, and claim that it is an indication that Greenland is melting down. Because they are crooks, not scientists.

There you go again, confusing the public with raw temperature data rather than the homogenized, rationalized and bastardized data that fit the climate models supported by 97% of the consensus science community.
No wonder Obama and associates are angry with you!
At the root if the climate debate, APS was high-jacked by fear in 1945:
After “The Great Social Experiment of 1945-2015” explained how world governments hid from the public the source of energy in the core of the Sun that
1. Made our chemical elements,
2. Birthed the entire solar system,
3. Sustained life’s origin & evolution,
4. Controls Earth’s climate today, . . .
https://dl.dropboxusercontent.com/u/10640850/Social_Experiment.pdf
An intriguing and extremely well-done video response described this period of totalitarian rule as “The Long Peace of 1945-2015:”
http://junkscience.com/2015/05/31/think-of-the-carnage-of-wwii-70-million-dead/
Fear and unwillingness to admit the Sun’s pulsar core rules the world have persuaded physicists & world leaders that humanity’s only options are:
_ a.) Worldwide nuclear war
_ b.) Tyrannical world rule by
_ c.) Nuclear energy paranoia
https://m.youtube.com/watch?v=ejCQrOTE-XA&feature=player_embedded
You know Steve, there’s a difference between climate and weather.
In 2010 there did not seem to be such a difference between climate and weather. It is interesting how the difference between climate and weather increases proportionally to how low the temperature drops.
Go back to school. There is no such thing as “scientific consensus.” All science is objective.
And NO POLITICIAN can claim “the science is settled.”
Go back to school.
Climate involves entire continents over a long period, even decades.
Obama is convinced he has everyone believing his “cause and effect catastrophism” because he knows most Americans are lazy and stupid and a lot prove him right by not getting informed and accepting his gospel. In 2012, the UN demanded $1.9 Trillion per year to fight global warming, nearly $800B from the US alone. No input or oversight on how the money is to be spent.
Obama has said he will include Climate Change into the TPP after congress has read the TPP drafts in secret PLUS anything else he wants to add.
I’m not sure why your comments from June 6 just popped up on my message board on June 26, but I can see I should have added a “/sarc” tag when I made my comment, back then.
Yes! Climate is Los Angeles and sometimes San Francisco except when it rains there and weather is all the cold places from Australia which is seeing blizzards to Hudson Bay which is still frozen nearly solid except a small strip on the West coast of Hudson Bay.
AGW needs another name change – Climate System Change.
For every action there is an equal and opposite reaction – science fact.
Reinforced by religion – Reap what you Sow.
. Record highs will be balanced by record lows which changes the dynamics of climate systems. Air currents move quicker creating volatile weather.
Nature is adapting to Mankind. Will she be kind to humans.
Wanna role the dice. Odds on for Anthropogenic Global Warming.
AdPost – Despite the sun going through a solar minimum, India experience a heatwave for April and May, with maximums reaching 47 C degrees. Australia also broke monthly averages for March with Queensland recording record averages and maximums. All despite the Liberal (Republican) Government repealing a carbon tax and funding Deniers.
On top of that, the Calbuco Volcanoe erupted in Chile on April 22 which would cause cooling. Extra hot in one area, then extra cold in another area. Who would have thought the Climate System was so complex?
The models confirm that global warming will cause more cooling.
That’s right, you should have paid attention to what the President’s Science Adviser had to say last year:
“The odds are that what we can expect as a result of global warming is to see more of this pattern of extreme cold. – – Dr. John Holdren, The White House – 1/8/2014
The same Holdren who predicted the ice age in the 70ies?
Wonder which of his opinions is more true?
I guess the one which lets him make more money!
btw-the same holdren who shouted out loud for total centralisation and forced sterilization in his fascist-but-green book eco science.
Why i am not surprised that this very same Holdren is shouting out loud “global warming” to create the main pillar of global controle,a global tax disguised as “save the climate-tax”
I’m pretty sure we both know that the only way to “convince” people world wide to pay a tax is a world wide threat-just like global warming.That’s why global warming exist.
What heats the planet earth? Reduced sunspot activity has been recorded for the last 10 years and counting. Last year had the fewest sunspots since 1906! Solar cycle 24 will prove to be the coldest period since the mini ice age which killed the Pilgrims during their first winter in this New Country. Cooling causes more deaths and devastation than warming. Solar cycle 24 could last for 30 years! Computer models cannot predict the future, they’re based on General Circulation Model (GCM) programming which is what your local weatherman uses in his weather forecasts, which are only accurate for 2 days at most.
Lie about the data that goes into these models and the finished product is the bigger lie of future forecasts. Michael Mann’s Hockey Stick Graph is one such lie because he purposely omitted the Medieval Warming Period from roughly 900 to 1300 A.D. He was proven wrong with his graph and forced to correct his data in scientific journals but he took over a year to retract his lies. Michael Mann’s Hockey Stick Graph is in your children’s school books! Vladimir Lenin was quoted as saying, “Give me four years to sew my seed within classrooms and it will never be removed.” AL Gore used that graph in his “An Inconvenient Truth.” The graph clearly shows that CO2 (carbon dioxide) follows rise in temperatures, NOT A CAUSE OF RISING TEMPERATURES! Which is the main mantra being shouted to milk money from the most prosperous nation on the planet!
I hope you forward this information to everyone you know, otherwise, they will remain Obama’s convenient idiots!
Looks like the jet-stream has been acting up again…weird that it happens so often these days…
But
Greenland has approved a bill allowing same-sex couples to marry. Lawmakers in the semi-autonomous country unanimously approved the bill by a 27-0 vote. The vote brought an end to a campaign that started back in 2010 to extend nuptials to homosexuals in the country. The law will come into force on 1 October.
http://www.icenews.is/2015/05/30/greenland-passes-same-sex-marriage-laws/
“homogenisation”
Well, people have to find some way to stay warm up there. Especially if we do away with fossil fuels.
Maybe one day, we will see skeptics and alarmists getting married…. (hahahaha… when hell freezes over??)
Nothing that Mosh, Zeke and Gavin can’t fix with a bit of “homogenisation” using their secret algorithms!
Give it a week, it will be the hottest year since records began.
Done.
http://news.yahoo.com/fed-data-shows-no-stopping-slowing-global-warming-180118324.html
The IPCC, Gavin, Kevin, Zeke… They’ve all been lying to us for the past 20 years. There’s been no slowdown at all in the warming. Does that qualify them as deniers? Obama was right the whole time. In a new study released today, NOAA just now realized that they forgot how to read a thermometer around 1999, then suddenly remembered in the past few months. Global warming never slowed down at all, and it’s far, far worse than we’ve been led to believe by the above mentioned deniers. Though, oddly, they quote Kevin as proof of Kevin’s wrongness.
The best part is where they say that they adjusted the ocean temperatures up, to make them more consistent with the land temperatures. Then, in the very next sentence, they say that they made a similar adjustment to the land temperatures a few years ago. Then they go on to describe anyone who disagrees with their competitive fudging as anti-science kooks, and outright call the satellite temperatures fraudulent. Has anyone ever asked Carl Mears why he continues doing work that he himself claims is wrong? If he thinks he’s in error, shouldn’t he be able to tell us why?
“Scientists at the National Oceanic and Atmospheric Administration readjusted thousands of weather data points to account for different measuring techniques through the decades.”
What is sad is that your average person is too ignorant to see through this steaming pile of excrement.
Excellent Article! This week is SUMMER and yet on the 2nd June we had HEAVY SNOW in the mountains of Scotland. This was said to be UNPRECIDENTED in the local paper!
What is happening to the Climate? Certainly NOT Global Warming! We have had only ONE SUNSPOT for weeks. I personally think that we are probably headed into an ICE-AGE by the looks of it. See on my website for yourself:- http://www.outofthebottomlesspit.co.uk/412667930
Best Wishes,
Steve
Your local paper must be edited by a 12 year old school kid.
Leo McGuire’s Song
Ah wis headin’ wi ma cromack up frae Gretna Green tae Skye
But ma journey has an element of farce.
‘Cos the calendar has stated – it’s the middle o’ July,
Yet here ah am wi’ snaw up tae ma arse, Oh – yo!
(chorus) Wi’ ma pipes below ma oxter an’ ma sporran neatly pressed
Ma pockets full o’ porridge for the road.
Wi’ some Crawford’s Tartan Shortbread an’ some tattie scones as weel
An’ ah’m jist aboot tae paint masel’ wi’ woad. Oh – yo!
And down here in SE Australia we are apparently having the coldest start to winter that we have had since 1931.
brrrrrr. ! Even Newy is feeling darn cold. !
Lets put things into some real perspective.
The GISP ice core data is almost certainly a good proxy for Arctic temperature change
https://edmhdotme.files.wordpress.com/2015/05/screen-shot-2015-05-25-at-11-09-40.png
See that little molehill on the far right, that is the so-called “warming” that people like Jimbo and his Exeter clown buddies (Betts, Cox) etc base their “warm-mongering” on. Pathetic isn’t it !!!!
Bat as you can clearly see, ITS STILL RATHER COLD relative to the rest of the Holocene, just a fraction of a degree out of the long cold of the Little Ice Age.
Most of the last 10,000 years has been 2 -3ºC WARMER, even surpassing the “dreaded” (lol) 2ºC warming tipping point several times, Arctic ice would have been open for significant periods each year, and unlike now, the Arctic would have been navigable for at least some portion of the year.. Fishing , trade etc would have been possible. Now the only passage is a maybe route with a powerful icebreaker.
And the Earth is still here.. Humanity and life on Earth survives, and in fact PROSPERED during that warmer 80-90% of the last 10, 000 years. The warm peaks of the RWP, MWP and Minoan were times of abundance and growth.
Now lets look back a little big further.
https://edmhdotme.files.wordpress.com/2015/05/screen-shot-2015-05-23-at-07-39-06.png
This is what they really want? seriously?
sorry, couple of typos. Its morning down the study heater hasn’t taken affect yet, and my fingers are freezing !!
I guess the Washington Compost did not get the memo? Must be just weather.
http://www.washingtonpost.com/blogs/capital-weather-gang/wp/2015/06/03/boston-has-its-coldest-days-to-start-june-in-recorded-history/
We know what alarmists always say. “Greenland is not the world, the US is not the world, Norway is not the world, Scotland is not the world, the world is not the world.” Only the parts cherry picked by alarmists are really the world.
Temperatures over the Greenland ice sheet are on a rising trend with summer surface-melting happening higher and higher up as the climate warms. Interesting.
No it isn’t.
Oh RLY? So how come Swiss Camp has been warming up 1.7C per decade since 1991?
http://adsabs.harvard.edu/abs/2013AGUFM.C33A0667S
Get back to us when you have some climate data rather than just weather.
GREENLAND IS NOT MELTING NOR IS ANTARCTICA. It is way, way too cold for either continent.
That is BS, there is a LOT of melting going on in Greenland every summer. Antarctica is not melting, however.
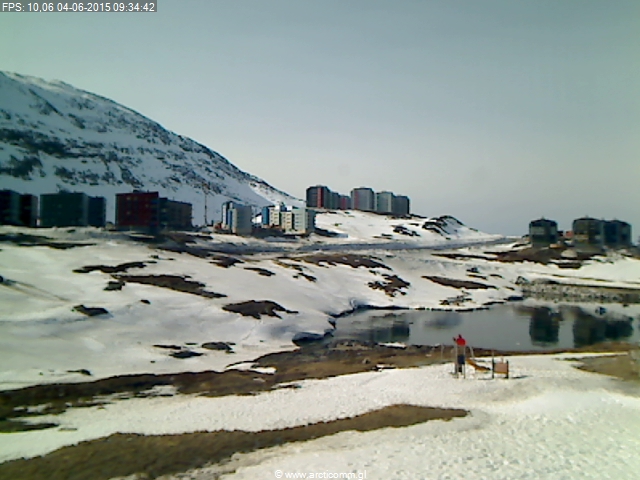
Go to Greenland this week and find this ‘melting’ that isn’t going on. This is a very cold start to summer.
I can see Nuuk Phil in that picture and he can see his shadow. Another six weeks of winter.
http://bigthink.com/ideafeed/weird-weather-in-alaska-concerns-climate-scientists
It would be good to see the historical trend on this location (if available). Another report of record high temps with no historical data to support it.
I bet it is not weird at all, just not so common recently.
Pingback: Here’s Why Global Warming Alarmists Don’t Talk About Greenland - Rage and War
Reblogged this on Climatism.
Is that standing water in the photo of Nuuk?
Since this is the space age, consider the satellite measurements of ice volume:
“Measurements from ESA’s CryoSat mission have been used to map the height of the huge ice sheets that blanket Greenland and Antarctica and show how they are changing. New results reveal combined ice volume loss at an unprecedented rate of 500 cubic kilometres a year.
…
The resulting maps reveal that Greenland alone is reducing in volume by about 375 cubic kilometres a year.
…
The researchers say the ice sheets’ annual contribution to sea-level rise has doubled since 2009. [Table 1 type contribution – i.e. thermal sea level rise (additional) is not included in that doubling]
Glaciologist Angelika Humbert, another of the study’s authors, added, “Since 2009, the volume loss in Greenland has increased by a factor of about two and the West Antarctic Ice Sheet by a factor of three.”
(Will This Float Your Boat – 5, quoting ESA Cryosat website).
And when the snow actually melts in summer to a lower level, no one on this blog will pay attention (unless it happens to support their preformed world view). This is a very convenient time to post the graph, and from a data source that claims that “Greenland is losing mass at about 200 Gt/yr.” So you believe the source when it show a lot accumulation and slow melt, but conveniently dismiss/ignore it when it states that it’s been losing mass for years. Great cherry picking of data.
Reblogged this on consciousshift2012 .
Pingback: Ocean off Iceland Unusually Cold, No Mackerel | the WeatherAction News Blog