
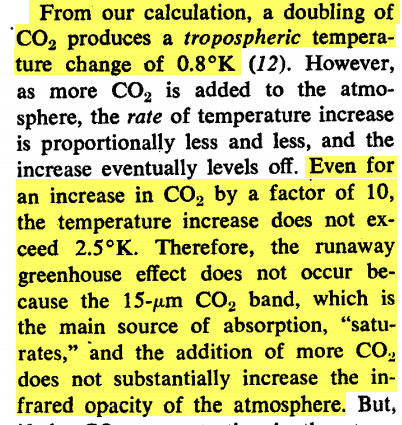
New York State is investigating Exxon for telling the truth about CO2 in 1976, but the big story is that NASA and NCAR have known since 1971 that CO2 is not dangerous – yet have lied to the public about this for over 30 years.
In 1971, the top climatologists at NCAR and NASA reported that a runaway greenhouse effect is not possible, because the CO2 absorption spectra is nearly saturated already.
vademecum.brandenberger.eu/pdf/klima/rasool_schneider_1971.pdf

This is exactly what NCAR’s current radiative transfer models show. Adding more CO2 has very little effect on downwelling longwave radiation.
But it is worse than it seems. Scientists have actually known for 115 years that CO2 is not dangerous.
Knut Ångström, asked an assistant to measure the passage of infrared radiation through a tube filled with carbon dioxide. The assistant (“Herr J. Koch,” otherwise unrecorded in history) put in rather less of the gas in total than would be found in a column of air reaching to the top of the atmosphere. The assistant reported that the amount of radiation that got through the tube scarcely changed when he cut the quantity of gas back by a third. Apparently it took only a trace of the gas to “saturate” the absorption — that is, in the bands of the spectrum where CO2 blocked radiation, it did it so thoroughly that more gas could make little difference.
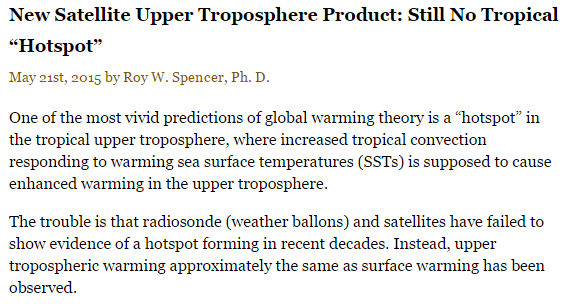
The evidence of fraud is overwhelming. An essential component of greenhouse gas theory is that a hotspot will appear in the upper troposphere. It hasn’t happened.
New Satellite Upper Troposphere Product: Still No Tropical “Hotspot” « Roy Spencer, PhD
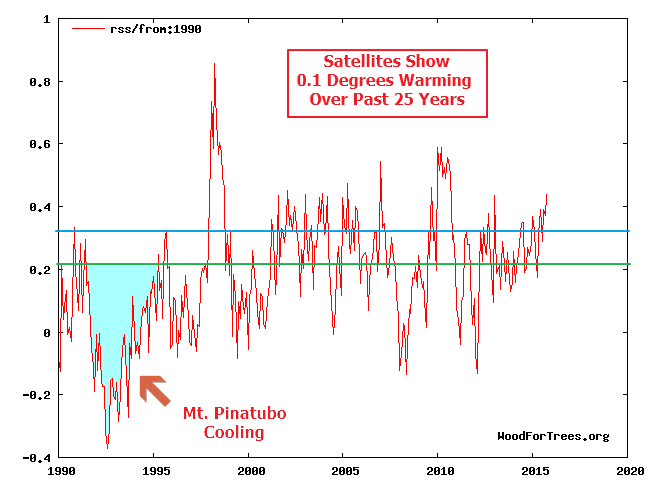
Satellites show that there has been about 0.1C warming over the past 25 years. Even less than the sensitivity calculated by Rasool and Schneider in 1971
All of the climate models have overestimated warming, many by a large amount.
It doesn’t matter how beautiful your theory is, it doesn’t matter how smart you are. If it doesn’t agree with experiment, it’s wrong.
Richard P. Feynman
Catastrophic global warming theory has failed. But rather than tell the truth and lose their reputations and funding, NASA and NOAA scientists have chosen to tamper with the data and continue lying to the public about something they have known is not a problem – for 45 years.

Zinger. 🙂
After 1971 NASA was busy hiding data from the 1969 Apollo Moon Landing that showed the SSM (standard solar model) was wrong.
Dr. Kenneth M. Towe of the Smithsonian has now acknowledged sending the following information to the Whitehouse:
https://www.researchgate.net/messages/attachment/690249_Solar%20storms%20and%20global%20warming%3F.png
Reblogged this on Canadian Climate Guy.
CAGW is all a house of cards and the winds of truth are a blowin’….. I love it!
The collapse already occurred on ResearchGate and someone there, probably Smithsonian’s Dr. Kenneth M. Towe, apparently informed the Whitehouse that the greatest threat to modern civilization is a SOLAR EMP; NOT AGW !
What about the video?
Who is to blame?
Crushing coal plants in Africa costs thousands of lives a day.
Low elevation level emission stacks and downwind planting of trees while electricity is used for desalinization was presented to “House” by my group in 1974.
Laughed out of DC by guess who?
Is that supposed to be obvious, I’m honestly curious about your proposal and who laughed you out of town. As you put it.
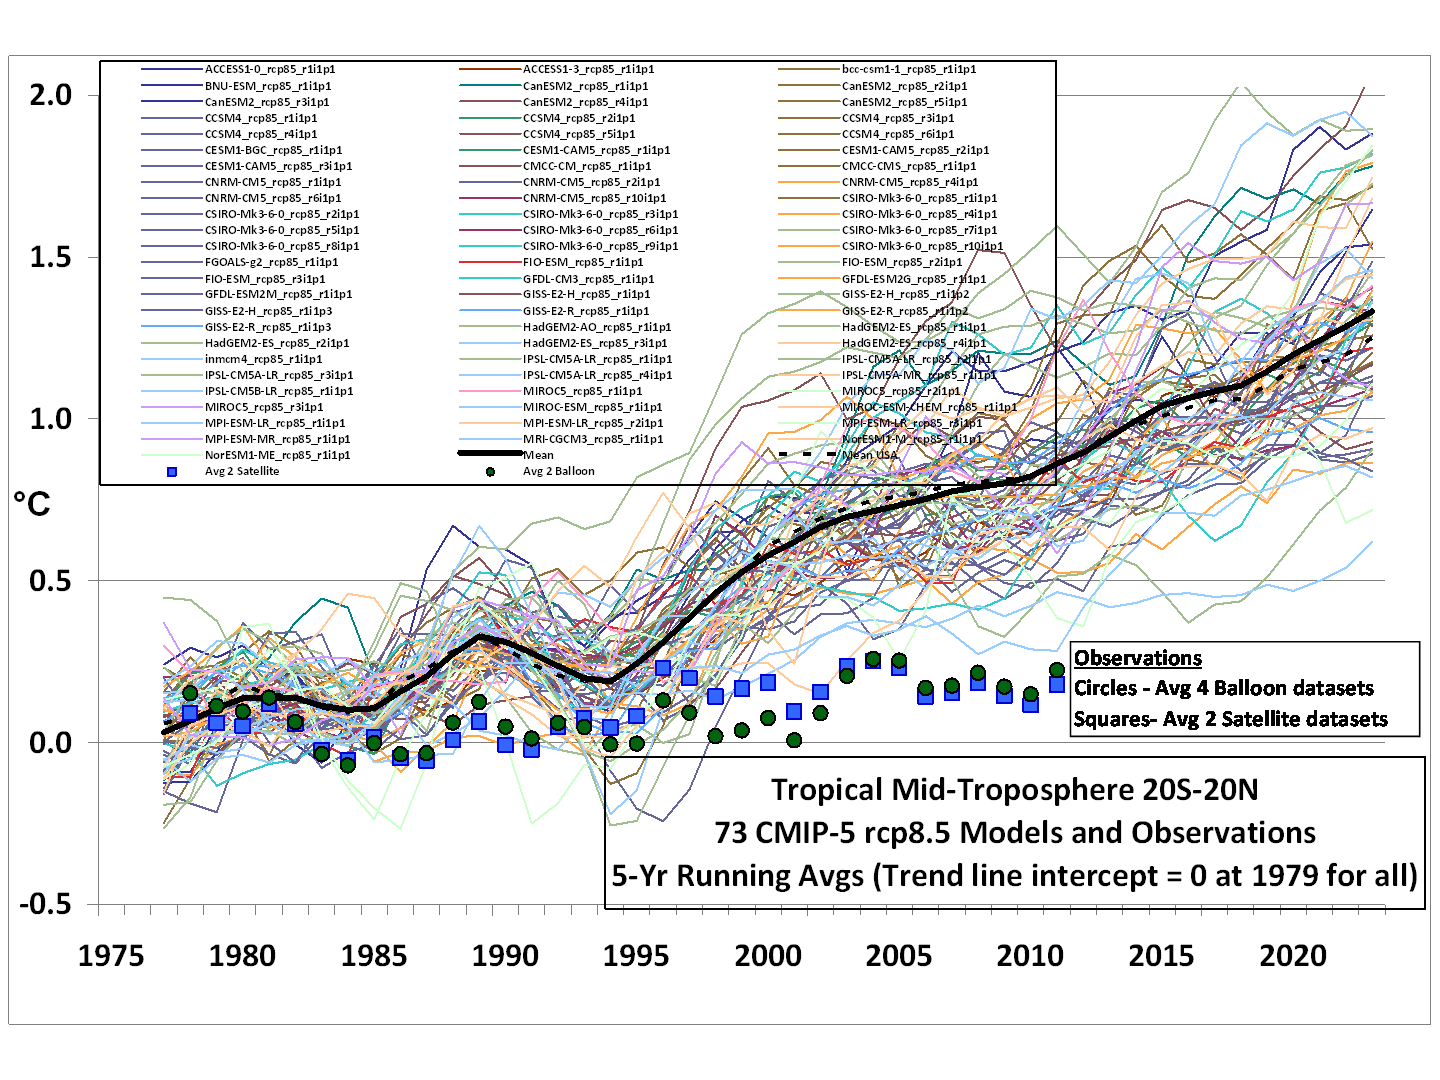
This is why they had to invent positive feedback loops and put them in their models, even though we do not find these feedbacks in nature. And the result is this…
http://www.coyoteblog.com/wp-content/uploads/2013/06/CMIP5-73-models-vs-obs-20N-20S-MT-5-yr-means1.png
The graph is for mid troposphere for 20S-20N only.
The observed and model global surface temperatures are shown in Fig 9.8, page 768 of the link:
http://www.climatechange2013.org/images/report/WG1AR5_Chapter09_FINAL.pdf
“The graph is for mid troposphere for 20S-20N only.”
Yes, and it shows how totally wrong the climate models are.
Get used to it.
Over the next few years as the temperature starts to drop, they are going to look like even more of A JOKE !!!
When the temperatures drop, they will blame it on the sun.
…or just ramp up the data adjustments
And just a reminder to all climate trolls…. yes , that’s you Dr Bozo.
YOU HAVE FAILED.
CO2 emissions will continue to increase, probably quite rapidly, over the next several decades.
China, India , Germany, Japan, South Africa and many other countries will continue to RAMP UP their coal and fossil fuel use.
All you may succeeded in doing is to lower the living standards in your own countries and maybe if your non-elected rulers (Turnbull in our case Dr Bozo) hand over control to a totalitarian UN that has absolutely no love for western society.
DOH !!!!!! Stupidity writ large. !
But we know that “stupidity” is Dr Bozo’s middle name.
Andy. CO2 emmissions may well increase dramatically over the coming decades. That does not count as any kind of evidence against the effects of increasing CO2 concentration. Nor do your views on the political implications of the science alter the validity of the science one iota.
By the way. Australia has a Westminster system of government. People vote for a member of parliament. The mp’s from the party which can command a majority in the house of representatives chooses a leader who is appointed by the Governor General to be Prime Minister.
Turnbull was elected leader of his party, and so appointed prime Minisiter.
As a former conservative Prime Minister John Howard said, the Prime Ministership is in the gift of the party, or the people if they vote out the party or the Prime Minister’s electorate votes him out of parliament. In 2007 Howard lost his seat and the party also lost power.
Still relying on abuse rather than analysis I see.
Even Lomborg, an alarmist, knows the proposals will do nothing to decrease temperature. That means the whole exercise is a WEALTH TRANSFER and Dr bozo, Philip Shehan has his greedy mitts out hoping to get his share and the he!! with how many children starve or old folks freeze to death!
Impact of Current Climate Proposals
https://www.youtube.com/watch?v=Dtbn9zBfJSs
So why is it that Phil wants to deny life to millions?
“….That does not count as any kind of evidence against the effects of increasing CO2 concentration. Nor do your views on the political implications of the science alter the validity of the science one iota…..”
The validity of the Lysenkoist science has been ripped to shreds by several scientists over the years. Not ONE aspect of ClimAstrology has been left unaltered, CO2 measurements, temperature measurements, sea level measurements even sea ice measurements have been rewritten to fit the script.
To protect the propaganda, the MSM will not allow skeptic scientists equal time. Skeptic comments have been barred in some of the MSM and now the WITCH HUNTS have begun with Willie Soon and Exxon in the cross hairs. Not that the witch hunts were not going on behind the scenes for years with Dr Happer being fired by Al Gore in 1993 and Australia stranding Murry Salby in Europe to name just a few.
An intelligent person only has to look at how the ‘debate’ is conducted to see that something stinks to high heavens especially when billions of tax payer dollars are funneled to areas that are no business of the government. Especially when the things that ARE the business of government are neglected.
This is just a few bridge collapses from 2015, it doesn’t even get into the Army Corp of Engineers fiasco with the levees in New Orleans that is STILL not fixed!
Bridge collapse closes main SoCal-Arizona route (east of the Coachella Valley )
http://cbsnews2.cbsistatic.com/hub/i/2015/07/20/03b82745-949a-40aa-9c1c-abf83865fbbc/1af82b6b43bd0648b54f332424be90d7/pickup-bridge-collapse-620.jpg
CORONA, Calif 9 workers injured bridge collapse
http://cdn.abclocal.go.com/content/kabc/images/cms/1026622_630x354.jpg
bridge collapse in Salado, TX
http://pbs.twimg.com/media/CBC0VLzWYAA90gQ.jpg
A truck driver is injured after a bridge in Cincinnati Ohio collapsed on Interstate 75.
http://i.dailymail.co.uk/i/pix/2015/01/20/24E0402800000578-2917738-image-a-40_1421771379230.jpg
Imagine if we put all the resources wasted on the Trillion Dollar Climate Change Industry into curing diseases and feeding people who struggle to survive day to day right now.
About 21,000 people die every day of hunger or hunger-related causes, according to the United Nations. This is one person every four seconds, as you can see on this display. Sadly, it is children who die most often.
Yet there is plenty of food in the world for everyone. The problem is that hungry people are trapped in severe poverty. They lack the money to buy enough food to nourish themselves. Being constantly malnourished, they become weaker and often sick. This makes them increasingly less able to work, which then makes them even poorer and hungrier. This downward spiral often continues until death for them and their families.
http://www.poverty.com/
That works out to 7,665,000 every year.
https://www.youtube.com/watch?v=Dtbn9zBfJSs
But the Phil’s of the world prefer to assign green stars to those they deem unworthy of life.
Gator,
It is even worse than that. The ones who do manage to survive are damaged.
Role of red meat in the diet for children and adolescents. (I had another on fetal brain development but it has been scrubbed from the wayback machine too.)
One researcher in Canada a few years ago got slammed hard for the research he did finding intelligence “IQ” was 80 in African blacks in Africa. Actually that is not surprising given malnutrition and generations of inbreeding.
This is why the UN hates meat. The left is not satisfied with the dumbing down of our schools, so now they want to dumb down our children. It’s about fairness.
I see we can add Gail Combs to the list of people who are incapable of scientific debate and resort to personal abuse as a substitute.
If everything you claim in your post about economic responses to AGW is true and half the planet were to die as a consequence, that would not alter the science of climate change one iota.
I am discussing science here. Not social or economic policy.
Philip Shehan says: @ November 10, 2015 at 9:29 pm
I see we can add Gail Combs to the list of people who are incapable of scientific debate and resort to personal abuse as a substitute.
If everything you claim in your post about economic responses to AGW is true and half the planet were to die as a consequence, that would not alter the science of climate change one iota.
I am discussing science here. Not social or economic policy.
>>>>>>>>>>>>>>>>>
NO you are NOT “discussing science here,” you are propping up a political con game. The discussion of ‘science’ was over in 1988 when Ex-senator Tim Wirth and Hansen played dirty tricks on the Senate to prop up the CAGW myth.
Tim Wirth even says:
“We’ve got to ride this global warming issue. Even if the theory of global warming is wrong, we will be doing the right thing in terms of economic and environmental policy.” – Timothy Wirth, who is now President of the UN Foundation
.
Ted Turner, founder of the UN Foundation says:
“A total population of 250-300 million people, a 95% decline from present levels, would be ideal.”
The discussion of ‘science’ was over in 1993 when Dr Happer was fired by then VP Al Gore for defending science.
The discussion of ‘science’ was over eleven years ago in 2004 when Dr Zbigniew Jaworowski tore the CO2 con game to shreds in front of the Senate and exposed how the con was done.
Although Dr Jaworowski’s university told him his peer-reviewed paper was scientifically sound they fired him ‘for political/funding reasons’ anyway. A scientific study that would have killed the con dead was denied funding because the prospective sponsors of the research claimed “the research would be “immoral” if it served to undermine the foundations of climate research.”
ALL of these pieces of evidence SHOUT POLITICS not SCIENCE!
Dr Jeff Glassman also ripped the CO2 con game to shreds HERE in 2006 and HERE in 2007.
So have Dr Lindzen, Dr. Choi, Dr Spencer, Dr Braswell, Dr. Idso, Dr Segalstad, Dr Essenhigh Dr. Willi Soon, Dr Happer and Dr.Freeman Dyson among many others and now Dr Evans. If these excellent scientists can not kill the beast with empirical science. If ‘the Pause’ that is LONGER than the 15 to 17 years needed to ‘falsify’ cannot kill the beast then it sure as heck is not and never has been about science.
If it was about science and not politics we could all go home and use the money on something useful. Instead you and your fellow enablers are helping KILL innocent children in third world countries and old folks in the UK. Ever hear of accessory to manslaughter BEFORE the fact? Oh, that’s right if the killing is for ‘political reasons’ and in the thousands and millions, it is considered OK.
Phil, maybe you should read your links before you post them, nothing in that post refutes the fact that the models were wrong and that there is no hotspot.
F-
Tell me, why do climate models use positive feedbacks not found in nature? Is it because we cannot list all climate forcings, cannot order them from most to least effective, and cannot then quantify them? Is it to keep the trillion dollar climate change industry alive?
Can you provide even one peer reviewed paper that refutes natural variability as the cause of recent, or any, global climate changes?
Can you ask honest questions?
Gator. Models are approximations of reality. They are often improved over time.
Copernicus’ model of a heliocentric universe was seriously flawed. It had the stars equidistant from the sun. It had circular orbits. The errors were corrected over time. Each time the model was a better match with reality. The last adjustment was the correction from Newtonian picture of gravity to Einsteins curved space-time, which corrected the error in the orbit of mercury.
During this centuries long process, nobody threw out the baby with the bathwater and declared “The model has failed. The earth is the centre of the universe.”
The 1971 model of Rasool and Schneider, which ironically is being presented as the last and final word on the subject and refusal to fully accept it over the last 44 years constitutes lying, is an example of a very early model based on limited data and understanding.
Ten years later Hansen produced a 3 parameter model (Solar Volcanoes and CO2) which has stood the test of time very well.
http://www.realclimate.org/index.php/archives/2012/04/evaluating-a-1981-temperature-projection/
But of course this model was not the last word either. Further data and understanding lead to the models in the AR5 report in the link I have referenced above. The fit of the data with the models is extremely good.
But recently many have suggested that the contribution of a natural forcings, the Pacific decadal oscillation and the Atlantic meridional oscillation with their 60 year periods have not been sufficiently recognised and their inclusion in future iterations of the models will probably improve the fit.
Smaller scale regional models are more difficult to fit that global models. That I suspect is why those who wish to claim that the models have failed have selected a restricted area and time frame to try and make the case that all the models are wrong.
It’s as if someone back in the 16th century concentrated on the lack of a fit with circular planetary orbits to declare that the model had failed and the earth is the centre of the universe.
A positive feedback associated with increasing CO2 concentration is that a warmer atmospheric temperature increases the humidity, the water content of the atmosphere and this is itself a greenhouse gas. Against this, cloud formation acts as a negative feedback. Another positive feedback is the decrease in albedo,.the reflectivity of the earth’s surface with smaller ice and snow cover. The difficulty in calculating the feedbacks, positive and negative, explains why there has been almost no progress in narrowing the IPCC range of 1.5 – 4.5 C over the past decades.
An example of the calculation of natural forcings only and natural plus anthropogenic forcings on temperature compared with observe temperature is given here:
http://www.ipcc.ch/publications_and_data/ar4/wg1/en/ch9s9-4-1-2.html
Copernicus’ model of a heliocentric universe was seriously flawed.
Nice strawman! We are discussing 100% failed climate models. And then there is the fact that to prop up the failed models, the alarmists keep changing the data.
There has been no increase in water vapor, and this is why I asked why models assume tghis when it is not found in nature.
New global water vapor findings contradict second draft of IPCC Assessment Report 5 (AR5)
Guest post by Forrest M. Mims III
I was an “expert reviewer” for the first and second order drafts of the 2013 Intergovernmental Report on Climate Change (IPCC) Assessment Report 5 (AR5). The names and reviews of all the reviewers will be posted online when the final report is released. Meanwhile, reviewers are required to not publish the draft report. However, the entire second draft report was leaked on December 13, 2012, without IPCC permission and has subsequently received wide publicity.
My review mainly concerns the role of water vapor, a key component of global climate models. A special concern is that a new paper on a major global water vapor study (NVAP-M) needs to be cited in the final draft of AR5.
This study shows no up or down trend in global water vapor, a finding of major significance that differs with studies cited in AR5. Climate modelers assume that water vapor, the principle greenhouse gas, will increase with carbon dioxide, but the NVAP-M study shows this has not occurred. Carbon dioxide has continued to increase, but global water vapor has not. Today (December 14, 2012) I asked a prominent climate scientist if I should release my review early in view of the release of the entire second draft report.
He suggested that I do so, and links to the official IPCC spreadsheet version and a Word version of my review are now posted near the top of my homepage atwww.forrestmims.org.
The official IPCC spreadsheet version of my review is here. A Word version is here.
A PDF version (prepared by Anthony from the Word version) is here:Mims_IPCC_AR5_SOD_Review
A relevant passage from the AR5 review by Mimms (added by Anthony):
The obvious concern to this reviewer, who has measured total column water vapor for 22.5 years, is the absence of any mention of the 2012 NVAP-M paper. This paper concludes,
“Therefore, at this time, we can neither prove nor disprove a robust trend in the global water vapor data.”
Non-specialist readers must be made aware of this finding and that it is at odds with some earlier papers. Many cited papers in AR5 have yet to be published, but the first NVAP-M paper was published earlier this year (after the FOD reviews) and is definitely worthy of citation: Thomas H. Vonder Haar, Janice L. Bytheway and John M. Forsythe. Weather and climate analyses using improved global water vapor observations. GEOPHYSICAL RESEARCH LETTERS, VOL. 39, L15802, 6 PP., 2012. doi:10.1029/2012GL052094.
Once again, your hand waving is not fooling anyone on this site.
Now, concentrate.
Please provide even one peer reviewed paper that refutes natural variability as the cause of recent, or any, global climate changes.
And what do alarmists say about the models? Atre they really “approximations of reality”? No…
“The models are convenient fictions
that provide something very useful.”
– Dr David Frame, climate modeler, Oxford University
And how well can we trust alarmists?
“No matter if the science of global warming is all phony…
climate change provides the greatest opportunity to
bring about justice and equality in the world.”
– Christine Stewart, former Canadian Minister of the Environment
“We’ve got to ride this global warming issue.
Even if the theory of global warming is wrong,
we will be doing the right thing in terms of
economic and environmental policy.”
– Timothy Wirth, President of the UN Foundation
And are they willing to lie? Yes!
“We need to get some broad based support,
to capture the public’s imagination…
So we have to offer up scary scenarios,
make simplified, dramatic statements
and make little mention of any doubts…
Each of us has to decide what the right balance
is between being effective and being honest.”
– Prof. Stephen Schneider,
Stanford Professor of Climatology, lead author of many IPCC reports
I will stand with those who do not lie, do not cheat, and do not make up fanssay models that are “convenient” for the cause.
Phil will do the opposite.
According to the NOAA State of the Climate 2008 report, climate computer model simulations show that if observations find that the globe has not warmed for periods of 15 years or more, the climate models predicting man-made warming from CO2 will be falsified at a confidence level of 95%:
“Near-zero and even negative trends are common for intervals of a decade or less in the simulations, due to the model’s internal climate variability. The simulations rule out (at the 95% level) zero trends for intervals of 15 yr or more, suggesting that an observed absence of warming of this duration is needed to create a discrepancy with the expected present-day warming rate.”
http://www1.ncdc.noaa.gov/pub/data/cmb/bams-sotc/climate-assessment-2008-lo-rez.pdf
Page 24, Middle column
According to Phil Jones, there has been no statistically significant warming since 1995 [16 years, 3 months ago]. Ergo, the climate models have already been falsified at the 95% confidence level and it’s time to revert to the null hypothesis that man made CO2 is not causing global warming.
He further admitted that in the last 15 years there had been no ‘statistically significant’ warming, although he argued this was a blip rather than the long-term trend.
http://www.dailymail.co.uk/news/article-1250872/Climategate-U-turn-Astonishment-scientist-centre-global-warming-email-row-admits-data-organised.html
We are now past 18 years and counting. No wonder they falsified data in an attempt to erase the pause.
Gator. The case of the Copernican model is not a straw man.
It is a perfectly legitimate example of the role of models in science. I can understand why deniers who want to claim that a model that is not 100% accurate (a virtual impossibility) has failed and must be abandoned find that example of how models work and are developed over time inconvenient.
Far from being 100% wrong, the models in Fig 9.8, page 768 of the AR5 report have a correlation coefficient r of 0.98 (98%) (Fig 9.6 page 765)
http://www.climatechange2013.org/images/report/WG1AR5_Chapter09_FINAL.pdf
Anyone familiar with scientific data knows that is an excellent fit.
And once again you appear to be basing your case that there has been no increase in atmospheric moisture content with rising temperatures ( a finding that I suggest defies common sense) on a paper you like which states that “Therefore, at this time, we can neither prove nor disprove a robust trend in the global water vapor data.”
There has been no pause in temperature for the last 18 years
The claim is based solely on RSS satellite data for which the trend and 2 sigma confidence limits since 1997 are
-0.001 ±0.169 °C/decade.
This means that there is a 95% probability that the trend is between warming of 0.168 and cooling of 0.170 decade.
The trend since the beginning of satellite data in 1979 is
0.121 ±0.063 °C/decade
There is no statistically significant difference between the warming trend for the entire satellite period and the last 18 years.
The trend for UAH satellite data since 1997 is
0.103 ±0.172 °C/decade
After the “natural fluctuation” of the extreme el nino in 1998, there is a return to the long term trend. From 1999:
0.147 ±0.174 °C/decade
There is no statistical difference between the UAH trends from 1997 and 1999 or the RSS trends from 1997 and 1979 and the UAH trend from 1979:
0.139 ±0.064 °C/decade
Several surface data sets show statistically significant warming for the last 18 years. NOAA Gistemp, Berkely, Hadcrut4 krig v2:
0.118 ±0.093 °C/decade
0.128 ±0.100 °C/decade
0.104 ±0.101 °C/decade
0.123 ±0.105 °C/decade
All the data sets, including RSS, are in statistical agreement.
All the data, including RSS data, is consistent with a statistically significant warming trend for the last 18 years.
This is mathematical fact, not hand waving.
Now concentrate.
I have already supplied the refutation requested. A bigger version:
http://www.ipcc.ch/publications_and_data/ar4/wg1/en/figure-9-5.html
The figure legend gives the reference: Stott et al. (2006b).
Phil, if you like your fraudulent data, you can keep ypour fraudulent data.
The models do not match the satellite data. And in case you forgot, NASA told us when the satellites were deployed that they would be the gold standard. You are comparing models to fudged data, the same kind of fudged data that claims there has been no pause.
Your hand waving is old news here, we have deconstructed the alarmist arguments for many years here.
Now please provide even one peer reviewed paper that refutes natural variability as the cause of recent, or any, global climate changes.
Gator you seem to have missed that fact that I am using UAH satellite data. Go tell Roy Spencer that it is fraudulent.
Odd, because this chart compares Dr Sprencer’s data with the failed models…
https://climatism.files.wordpress.com/2013/07/spencer-73-cmip5-model-fail.png
Maybe you should try again.
And where is that singular paper for which I have repeatedly asked? Hmmm?
I should have also mentioned that my statistical analysis is of RSS satellite data. Calling that data fraudulent?
So you have faith in Spencer’s data after all. So I am not using fraudulent data.
I have discussed the use of the data restricted in both region and time period and comparisons to models above. Cherry picking restricted data and claiming that all the models are wrong is nonsense. As I said, like declaring that Copernicus model was wrong and the earth is the centre of the universe because you concentrate on the fact that the data does not match the model which states that planetary orbits are circular.
I have twice given you the reference you asked for.
From Stott et al 2006
http://www.ipcc.ch/publications_and_data/ar4/wg1/en/figure-9-5.html
Phil, you are even dumber than I gave you credit for! 😆
From your link “refuting” NV…
… obtained from 58 simulations produced by 14 models with both anthropogenic and natural forcings.
Yes, failed models like these…
https://wattsupwiththat.files.wordpress.com/2015/07/clip_image026.jpg
… and these…
https://informativestats.files.wordpress.com/2013/10/hayden_ipcc_arrow.jpg
Your analysis sucks, and your understanding of science is nil. Do you know why?
I really like this annotated graph:
https://informativestats.files.wordpress.com/2013/10/hayden_ipcc_arrow.jpg
Look out Gail! Martin will accuse you of doctoring that graph. 😉
Tuwern’t me, Gator
I do not have the computer skills.
There is only one rung and sphere higher than “Extremely Likely”. Will The One We’ve Been Waiting For, His Holiness the Fourteenth Dalai Lama and The Bishop of Rome jointly bring the Received Truth to Paris?
Will the PowerPoint be handed down to them on Mount Sinai?
https://www.youtube.com/watch?v=ghSJsEVf0pU
I have been arguing this exact point for years.
Does Congress have any power of enforcement when it comes to an executive head flipping them the finger?
Congress’s Contempt Power and the Enforcement of Congressional Subpoenas: Law, History, Practice, and Procedure
Todd Garvey
Legislative Attorney
Alissa M. Dolan
Legislative Attorney
May 8, 2014
Seems Congress has no teeth and Obummer and the exec branch now have ALL the teeth. So much for separation of powers.
When Congress gave up their powers over writing the law to the executive via bureaucratic rule making (and enforcement) they really screwed over this country. Now we are paying for it.
In 2014 the House of Representatives has passed the “Enforce the Law” bill and of course Obummer threatened a veto Gov TrackStatus:
Died in a previous Congress (Not passed by Senate)
And the newest version is back sitting in committee since January. In the Senate this time ENFORCE the Law Act of 2015 Gov Track Prognosis:
0% chance of being enacted
NOAA are acting unlawfully. As a result neither they nor any of their results nor anyone who works for them can be trusted. As a result, they are an illegal organisation.
Whatever Congress tries to do will take longer than waiting until January 2017 when Trump moves to the white house and fires all the climate scoundrels.
We need to fire 90% of the bureaucracy in DC and in the state and local governments. We now have a situation where the parasites are close to 50% if you count government, welfare, SS, and jobs like accountant and lawyer directly related to government. (And that was before Obummer tossed many of the US workers out of jobs.)
Yep. Fire them before they find a way to put you out of a job. Because their goal is the new serfdom. Anyone with a job and a brain is a threat.
Apparently, acceding their authority on everything of import to the exec branch is what congress is all about these days. War making, trade deals, you name it, they’re actively making themselves more and more irrelevant. Shameful.
How else to you gradually form a dictatorship if you don’t secede powers to ‘THE ONE’
Masterful summary of the state-of-the art. Atmospheric science needs to look elsewhere – CO2 just doesn’t do much at this level of saturation. Fact. Deal with it warmunists.
Dr. Evans new Basic Climate model and Dr Happer’s recent work pretty much kill CO2 as a major problem.
However runaway governments promoting propaganda IS a major problem
Yes Gail,
My personal Political Model shows that runaway government propaganda wrt climate change is headed for a tipping point! Anything could happen!
But I think it will happen in Europe first.
https://notalotofpeopleknowthat.wordpress.com/2015/11/05/uk-grid-capacity/
“According to the National Grid, they were expecting peak demand of 49 GW yesterday, but were concerned about multiple breakdowns at UK power stations. This shows just how much reserve capacity is needed. Last winter, which was mild, demand peaked at 53.5 GW in January. However, as recently as February 2012, demand peaked as high as 59.1 GW, and in the following winter, demand frequently exceeded 56 GW.”
NASA engineers successfully reached the Moon in 1969 and returned with lunar soils that captured elements implanted by the solar wind. Isotope analysis of those elements reveled ~9-10 stages of solar mass-fraction that had selectively enriched lighter mass atoms over heavier atoms by the time these atoms reached the top of the photosphere to be discharged in the solar wind.
Solar mass-fractionation enriched H (1 amu) over Fe (56 amu) by more than a factor one million (10^6) by the time these atoms reached the top of the photosphere, hiding the Sun’s iron-rich interior.
NASA scientists tried to hide the iron-rich Sun from the public. In ~1970-71, Kuroda and I tried to expose this “cover-up”by publishing a paper in Nature showing that the isotopes of neon and xenon (over the mass range of 20 amu to 136 amu) had undergone the same mass-fractionation process.
Although we failed then, the facts are coming out today.
This has nothing to do with this topic. Stop spamming!
I finally have time to catch up on your excellent site, after digging myself out of the rubble of yet another catastrophic hurricane season…
Now I shall go to my Ohio farm to grow some oranges.
Reblogged this on WeatherAction News.
You cannot use one model from a 44 year old paper as evidence that people are lying.
Especially when temperature CO2 data since 1850 give an emprical figure for temperature increase with doubling of CO2 concentration of 2 C, within the IPCC range of 1.5 to 4.5 C.
http://oi46.tinypic.com/29faz45.jpg
Or take the temperature Co2 data from 1958 when Muana Loa data became available to 2014 (when I did the calculation).
http://www.woodfortrees.org/plot/hadcrut4gl/from:1958/mean:12/plot/esrl-co2/from:1958/normalise/scale:0.75/offset:0.2
The temperature trend for the hadcrut4 data is:
0.124 ± 0.023 °C/decade (2?) giving a temperature increase for the entire 56 year period
0.694 ± 0.124 °C (The error margin is 19%)
The change in CO2 concentration for that period is from 315 to 400 ppm (We will neglect the small error in CO2 concentration as this data is much less noisy than the temperature data)
The equation for temperature rise with increasing CO2 is therefore
0.694 = k log(400/315) where k is the proportionality constant.
0.694 = k x 0.239
k = 0.694/239 = 2.91
The temperature rise for a doubling of CO2 concentration is therefore
2.91 x log2 =
2.01 ± 0.38 °C
Given the noisy data, the remarkable agreement with the figure from 1850 (2.04 ± 0.07 °C) should be regarded as fortuitous.
The temperature trend for the UAH data from 1979 to the present is
Trend: 0.138 ±0.070 °C/decade (2?) (With a 35 year data set the error margin has blown out to 51% from 19% for the data from 56 year data set.)
The rise in CO2 concentration for this period is 338 to 400 ppm
Repeating the calculations above for this data means that doubling of CO2 concentration gives a temperature rise of
1.80 ± 0.91 °C
Which is in experimental agreement with the earlier calculations but the error margin is very high.
Thus for 3 different time periods, the emprical value for temperature rise is with doubling of CO2 is C, compared to 0.08 C from the model in the paper.
Regarding the saturation point for CO2 concentration. The compression of the graph makes it very difficult to see what is going on, but it does not agree with the following graph:
https://knowledgedrift.files.wordpress.com/2010/05/log1-co2.jpg
Dr Brainless surfaces again
So hilarious watching him regurgitate the same old lies and mathematical faeces he is so wont to do.
The GISS adjustments, as we all know are a near perfect alignment with CO2 level.
So, of course the temperature aligns with CO2 increases.
He KNOWS that nothing before 1979 from GISS or HadCrut is now valid.. but accepts all the maladjustments and tries to use them to spread propaganda BS.
One wonders just how much of that acceptance of fudged data is a remnant from his doctorate. 😉
Andy neglects the fact that I have made a calculation for UAH satellite data from 1979 which produces the same result as the Hadcrut4 data (Not Giss).
Andy asserts that I know that nothing before 1979 from Giss or Hadcrut is now valid. I know no such thing, but I do know know that people like Andy constantly assert it.
Skeptic Richard Muller investigated this through the Berkeley Earth Project and produced the BEST series of temperature data which was in a agreement with Giss and Hadcrut.
The other day on Mr Bolt’s blog I discussed the difference between genuine skeptics and deniers. Andy restricts his rebuttal of my analysis to indulging in personal abuse and makes assertions unbacked by evidence.
He is in the latter category.
Skeptic Richard Muller investigated this… 😆
Muller was never a skeptic. But he fooled you, twice! 😆
By Richard Muller on December 17, 2003
Let me be clear. My own reading of the literature and study of paleoclimate suggests strongly thatcarbon dioxide from burning of fossil fuels will prove to be the greatest pollutant of human history. It is likely to have severe and detrimental effects on global climate. I would love to believe that the results of Mann et al. are correct, and that the last few years have been the warmest in a millennium.
http://www.technologyreview.com/news/402357/medieval-global-warming/page/2/
11/03/11
“It is ironic if some people treat me as a traitor, since I was never a skeptic“
http://www.huffingtonpost.com/2011/11/03/its-science-not-skepticis_n_1072419.html
Less than a year after announcing that he was never a skeptic, he announced that he was a converted skeptic.
The Conversion of a Climate-Change Skeptic
By RICHARD A. MULLER
Published: July 28, 2012
CALL me a converted skeptic.
http://www.nytimes.com/2012/07/30/opinion/the-conversion-of-a-climate-change-skeptic.html?_r=1
Thankyou Phil, for illustrating that the opposite of skeptical, is gullible. 😆
Gator, Muller was one of those who forcefully attacked the “hockey stick”.
You see, a genuine skeptic is one who looks at the data and forms an opinion on the results. He does not reject the results because of a preconceived idea. That is why he is a genuine skeptic, not a denier. Or as the link says:
“Skepticism is not a position you stake out ahead of time and defend no matter what.” Michael Shermer
Real skeptics follow the data. Theyt can change their minds.
https://www.youtube.com/watch?v=wfn9FaJKPwo
Again you need to show where the BEST data gets it wrong, not simply condemn it out of hand.
http://berkeleyearth.org/about/
So the fact that Muller lied about being a skeptic means nothing to you? That says all I need to know Phil, because your indifference to the lies by your go-to guys is coomon in all alarmists.
As for BEST?
JOURNAL OF GEOPHYSICAL RESEARCH
http://onlinelibrary.wiley.com/doi/10.1029/2010JD015146/abstract
According to the best-sited stations, the diurnal temperature range in the lower 48 states has no century-scale trend.
The current rating of surface stations (82.5% surveyed) as of 07/30/2012
CRN Rating:
CRN1-2, 7.9%
CRN3-5, 92.1%
1 Flat and horizontal ground surrounded by a clear surface with
a slope below 1/3 (<19°). Grass/low vegetation ground cover
3 degrees.
2 Same as Class 1 with the following differences. Surrounding
Vegetation 5°.
3 (error 1°C) ? Same as Class 2, except no artificial heating
sources within 10 meters.
4 (error ?2°C) ? Artificial heating sources <10 meters
5 (error ?5°C) ? Temperature sensor located next to/above an
artificial heating source, such a building, roof top, parking lot,
or concrete surface
https://pielkeclimatesci.files.wordpress.com/2011/07/r-367.pdf
Once again, you cherry pick your info and ignore the glaring problems. This is why I asked if you could ask an honest question.
“…Skeptic Richard Muller investigated this through the Berkeley Earth Project ….”
Well if you believe THAT lie no wonder you believe all the rest of the lies!
Alarmists support whatever advances “the cause”, and deny anything that works against it. They are bots, they are part of a collectiove that does not think on its own.
I have thoroughly trashed you statistical CRAP so many times in the past, it not worth even repeating again, because you do not have the climate understanding to do anything except cherry-picked statistical farce. Its what you excel at.. I assume learnt during your doctorate years.
Its been funny watching your statistical maleficence as you vainly try to DENY the current 18 or so year PLATEAU.
Its going to be even funnier watching what sort of statistical excrement you come up with once the current El Nino dies out and temperatures start to drop. 🙂
Find a big rock to crawl under, Dr Bozo.
Oh , you do know that a zero trend in RSS is statistically supportable back 26.2 years, Don’t you ? 🙂
Sorry, make that 26 years.
Ross McKitrick also verified the 26 year period.
And you are not qualified or educated enough to clean even his shoes.
Andy having waded through the hyperventilating personal abuse I came across the claim that:
Oh , you do know that a zero trend in RSS is statistically supportable back 26.2 years, Don’t you ? Sorry, make that 26 years.
I think you will find that the RSS trend from November 1989 is 0.108 ±0.108 °C/decade. It means that there is a 95% probability that the trend is between 0.000 and 0.216 °C/decade. That does not statistically support a zero warming trend.
Again your ignorance of statistics shines through. 🙂
Even your statement confirms my point.
Thanks for confirming. Dr Bozo.
Ross McKitrick also verified the 26 year period.
And you are not qualified or educated enough to clean even his shoes.
Andy. Actually I had an email discussion with McKitrick on this subject. Nice man. He confirmed that his data did not mean that there was a statistically significant zero trend for the periods he nominates.
You are drawing the false conclusion that because a data set is short enough so that the data no longer shows statistically significant warming (the trend plus the confidence limits are greater than zero) that means that a trend of zero is “statistically supportable”
That is nonsense.
There is as much statistical support that the trend is equal or greater 0.216 °C/decade as there is that it is equal to or less than 0.000 °C/decade. That probability in both cases 2.5%.
You any warming data not statistically significant by making the period short enough to make the confidence limits greater than the trend.
Instead of beginning in November 1989, lets go back to 0ctober 1989.
0.109 ±0.108 °C/decade
There is a statistically significant warming trend.
You can chop any statistically significant warming trend into short , non statistically significant warming sections.
http://tinyurl.com/loyk736
Once again you seem to think that hurling personal abuse demonstrates something other than your inability to mount a scientific argument.
Instead of making comments like this:
“Again your ignorance of statistics shines through. 🙂
Even your statement confirms my point.
Thanks for confirming. Dr Bozo.”
Or this
“OMG, you have never even bothered to figure it out, have you. !”
in response to my question
“Andy. How does the el nino event of 1998 being a step event change the fact that the temperature increase from 1979 to 2014 was 0.48 ± 0.25 C?”
try actually explaining where I am wrong and you are right. Otherwise I and other readers may conclude you are hiding your ignorance and inability to mount a scientific argument behind abuse and bluster.
He still has zero understanding that the 1998 El Nino was a step event, that’s how poor his understanding of anything to do with climate is.
You watch, his next trick will be to cherrypick the low point in 1999 to try to prove that the plateau doesn’t exist.
Go for it, Dr BOZO !!
Andy. How does the el nino event of 1998 being a step event change the fact that the temperature increase from 1979 to 2014 was 0.48 ± 0.25 C?
OMG, you have never even bothered to figure it out, have you. !
You just stick to randomly punch out junk on your little trend calculator, Dr Bozo.
Its all the thinking you are capable of.
You KNOW they are getting desperate when Dr Bozo appears..
The very bottom of the barrel.
Dr Happer’s finding that the Climate modelers missed the boat is in using equations for ‘line broadening’ aka the ‘wings’ where the current CO2 absorption ( at 400 ppm) is supposedly taking place. Actual measurements show the ‘broadening’ ain’t so broad. In other words CO2 is ‘saturated’ and the temperature/CO2 ppm curve goes flat for all intents and purposes at 400ppm.
That means the right side of this graph is essentially at zero.
https://wattsupwiththat.files.wordpress.com/2010/03/heating_effect_of_co2.png
The water vapor feed back that the ‘Catastrophic’ part of CAGW depends on is also dead in the water because of actual measurements showing no increase and Dr Evans backs this up with finding errors in the architecture of the basic climate model.
http://forums.windowscentral.com/attachments/windows-10-mobile-insider-preview/108351d1381515339t-dead-its-dead-jim.jpg
Dr Shehead is saying an empirical 2 C per doubling falls neatly within the IPCC range of 2 – 4 C per doubling. Nice. Right in the middle.
But what is it really? What is the real empirical climate sensitivity? Since 2000 the CO2 has gone up from 360 to 400 ppm which is 40/400 which is 0.1 doublings, and the global temp since 2000 has gone up by 0.00C
0 C per 0.1 doublings of CO2 is a climate sensitivity of 0 C.
Morgan I don’t know how you conclude that 2 C is right in the middle of a range of 2-4 C.
The actual IPCC range is 1.5 -4.5 C. 2 C is at the low end of that range.
A period of 15 years is too short from which to get a reliable temperature trend and therefore a sensitivity parameter.
As I wrote above, the 2 sigma or 95% confidence limits grew from a 19% for a 56 year time frame to 51 % for a 35 year time frame
The UAH temperature trend for 15 years and 10 months since January 2000 is
0.122 ±0.189 °C/decade.
The confidence limits are 155% the size of the trend value. No reliable value for the sensitivity parameter can be calculated from such data.
I was being sarcastic. How’s about this for empirical climate sensitivity. We’ll use Venus, which is 400 C hotter than earth. How many doublings before earth has the same CO2 as Venus? Venus has 990,000 ppm CO2 and 93 times denser so it has 92,000,000 pp earth million. Let’s start doubling from 400:
800
1600
3200
6400
12800
25600
50 k
100 k
200 k
400 k
800 k
1.6 m
3.2 m
6.4 m
12.8 m
25 m
50 m
100 m
So, 18 doublings and we are like Venus.
400 / 18 = 22, so climate sensitivity is 22 C per doubling
Too much for Dr Bozo.. he needs his trend calculator. 😉
Yawn.
The only warming in the whole the RSS data has been the approx. 0.26C jump at the extended El Nino around 1998.
The slight solar warming from 1979 -1997 has been all but cancelled by the slight cooling since 2001.
Its a pity that Dr bozo has zero understanding on actually figuring out what the climate is actually doing.. Would enable him to post something with some sort of scientific basis rather than cherry-picked trend analysis that even a child could do in a vain attempt to try and reinforce his rabid, brain-washed AGW beliefs.
Thing is Dr Bozo.
Thre is absolutely no CO2 warming signal in the whole of the satellite data. Get used to that fact.
http://woodfortrees.org/plot/rss/from:1979/plot/rss/from:2001.2/trend/plot/rss/from:1979/to:1996/trend/plot/rss/from:2001.2/trend/offset:-.26
The newest info on a CO2 climate sensitivity: It is possible to put an upper bound on it — which is about half a degree. The most likely estimate is around 0.25°C. Empirical estimates by Lindzen and Choi,[1][2] Spencer and Braswell[3][4] and Idso[5] suggest it is 0.4°C – 0.7°C.
So he is off by a factor of ten. He really needs to keep up.
OOPS forgot to link, but it is worth repeating: It is possible to put an upper bound on it — which is about half a degree. The most likely estimate is around 0.25°C. Empirical estimates by Lindzen and Choi,[1][2] Spencer and Braswell[3][4] and Idso[5] suggest it is 0.4°C – 0.7°C.
Morgan. I realised you were being sarcastic, but I don’t understand why you think that the actual figure must be in the middle of a range.
I do not see the relevance of the situation on Venus which is closer to the sun and has much higher concentrations of CO2 and much higher atmospheric pressure. You cannot linearly extrapolate from one planet to the other.
When he gets through with his ritual abuse, Andy puts up a graph chopped into sections to show that there is absolutely no CO2 warming signal over the whole of the satellite data.
As I note above Andy can to better than that if he puts his ‘mind’ to it.
He can take any statistically significant warming trend, chop it into none statistically significant segments, declare that it is “statistically supportable” that each segment has a zero temperature trend and therefore, the sum of the segments means that the entire previously statistically significant warming trend therefore has a statistically supportable zero temperature trend.
And remember this can be done with any temperature trend you like.
Here is Andy’s graph, to which i have added the trend for the whole satellite period.
http://tinyurl.com/ohvosn6
For the whole period there is a statistically significant warming trend of
0.121 ±0.063 °C/decade
For Andy’s cherry picked period from 1979 to 1996:
0.066 ±0.190 °C/decade
and from 2001.2
-0.034 ±0.208 °C/decade
Now the problem with the short periods is that the error margins (95% confidence limits) are so large you can drive a bus through them.
For the first short period the real trend is somewhere, with 95% confidence, between warming of 0.256 and cooling of 0.124 °C/decade.
For the second the trend is somewhere between warming of 0.174 and cooling of 0.242 °C/decade.
This means that statistically these trends are in agreement with the statistically significant warming trend of 0.121 ±0.063 °C/decade.
Real climate sensitivity since 1880 is 0.6 degrees / 0.4 doublings
= 1.5 C / doubling
But that’s assuming that all that 0.6 degrees was due to CO2, which is wasn’t, because much of it happened between 1908 and 1940. So, real climate sensitivity is way less than the 2-4 C that the morons at the IPCC are being paid to rant about.
For the figure of 0.6 warming from 1880 to now, I used the GISS chart from 2002, before the worst of the the massive data tampering was done.
And that doesn’t include the the Grand Solar Maximum
Given all the Trolls are doubling down, you know we are coming up to a very important gabfest.
https://s-media-cache-ak0.pinimg.com/736x/bd/9b/61/bd9b617a4bf32be4a9577bb138f54e38.jpg
https://whatyouthoughtiwentaway.files.wordpress.com/2015/09/democracy-two-wolves-and-a-sheep-voting-on-whats-for-dinner.jpg
Be careful the lambs don’t shoot back!
http://4.bp.blogspot.com/_TZIN3wCHiCs/S_48jwNkQcI/AAAAAAAABI8/P27AF5SLv7I/s320/sheep.jpg
Truly a great find.. a great Post.
Thank you Steven for all this great work… and most important… enduring all the REAL SKEPTICS, the Hoaxers… and the TRoLLs..
Reblogged this on 4timesayear's Blog.
Reblogged this on Climate Collections.