
NSIDC has corrupted climate science with graphs like these, purported to show a linear decline in Arctic sea ice since 1979.
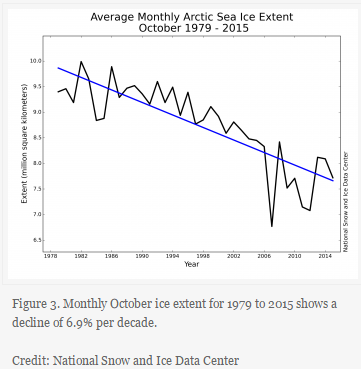
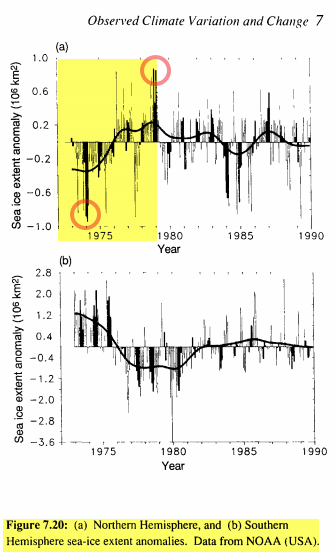
Their choice of 1979 as a start point, hides the fact that Arctic ice is cyclical, not linear. The 1990 IPCC report showed that sea ice extent was two million km² smaller in 1974 than it was in 1979.
The New York Times reported another large increase in ice prior to 1971.

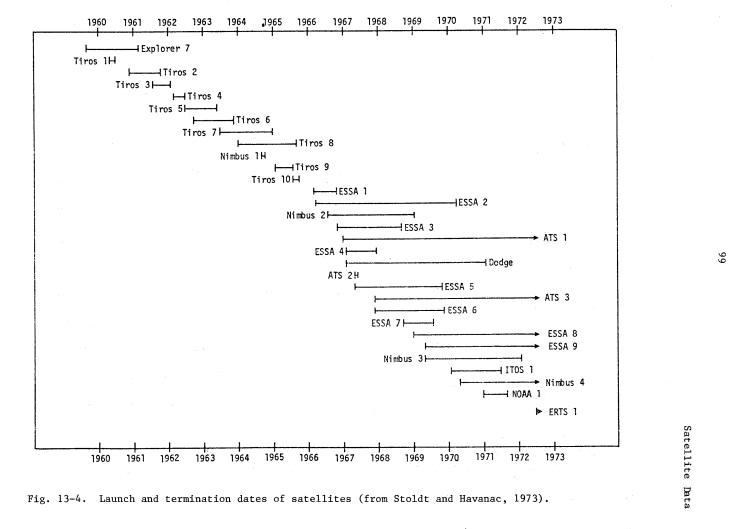
There was plenty of satellite data available before 1979. NSIDC could get the data right up the road at NCAR.
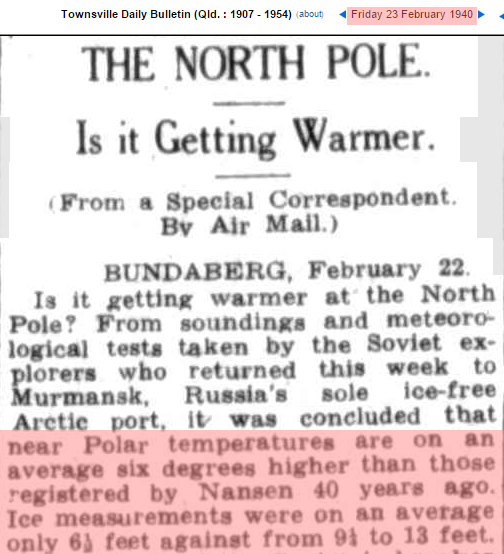
Arctic sea ice thickness was the same in 1940 as it is now.
23 Feb 1940 – THE NORTH POLE. Is it Getting Warmer. | BUNDABER…
Papers Past — Auckland Star — 14 December 1940 — WARMER ARCTIC
By starting their plots in 1979, NSIDC is defrauding the public. We went to the moon in 1969 – human intelligence did not begin in 1979.

5, 4, 3, 2, 1, Hi Martin, how are you today?
“human intelligence did not begin in 1979.”
But from the fact that so, so many have fallen for the AGW scam….
… I strong suspect that human intelligence started into a deep decline around that time.
Agreed. As a teen, I could actually see the decline in education between me and the kids a year younger that I was tutoring in the 1960s and 1970s. I was so obvious a teenager could see it!
I have continually posted graphics of Mt Baker glaciers, AMO, AMO vs Swiss glaciers etc
ALL of them show that 1979 was a PEAK in the NATURAL CYCLES in NH ice levels
To start at 1979 without showing this cyclic behaviour is tantamount to FRAUD.
I remember looking at printed paper-bound books of daily stitched polar orbiting IR satellite imagery from ESSA and Nimbus satellites back in the mid and late 70’s to look at tropical cyclones around the world. I visited the NOAA Pacific satellite center near San Francisco in 1978 and remember seeing their high resolution visible and IR imagery (hi-res for those days) which was not easy to get back then. We usually had to settle for fax imagery back then. The fact that the images were stitched suggests the data is digital and could easily be used. I’m not sure they had all the IR channels that are available now on satellites to help distinguish ice from clouds like on NASA’s Worldview (which I use regularly) with its MODIS imagery (wish they would add VIIRS).
1979 is the mother of all cherry picks for a whole host of climate alarmist scams. 1979 was the coldest year in modern history, after a well documented 40 year period of global cooling.
So basically what the scamsters are saying is that if it is currently warmer that the coldest year on record, there must be global warming. When in reality, most of the post 1979 temperature increase with non tampered data has simply reflected a return to 1940-1960 normals.
“1979 was the coldest year in modern history”
I would say 1977 was the coldest, based on several lines of evidence. NCDC global data shows Land/sea was colder in 1965 (-0.17°C), but the surface land data clearly shows 1977 was colder than 1979, at -0.29°C you have to go to 1918 to get a colder land reading. (and yes, the data has been adjusted)
But the US only station data clearly shows 1977 was the coldest year (since 1918), and even with the adjustments, it’s pretty obvious 1977 was the coldest year. Not that 1979 wasn’t also cold, but 1977 stands out in the actual raw data. Steve should be able to confirm this with his program.
It doesn’t change the cherry picking, especially for ice data. 77 and 79 were the ending of the global cooling that had been driving the “coming ice age” scare.
As an interesting aside, Alaska shows the cooling trend ending there with 75 the last really cold year. So it’s probable the cooling trend ended first in the polar regions.
Expedition To Study Global Warming Put On Hold Because Of TOO MUCH ICE
07/22/2015
An expedition to study the effects of global warming was put on hold Wednesday. The reason? Too much ice.
The CCGS Amundsen, a Medium Arctic icebreaker and Arctic research vessel operated by the Canadian Coast Guard, was to travel throughout Hudson Bay, a body of water in northeastern Canada, but was rerouted to help ships who were stuck in the icy water.
A Coast Guard officer said the conditions were the “worst he’s seen in 20 years,”
http://dailycaller.com/2015/07/22/expedition-to-study-global-warming-put-on-hold-because-of-too-much-ice/
Hey, wait there, isn’t 07/22/2015 summer up there ?
Or is there a Hudson bay somewhere in Antarctica?
GOREBull WArbling strikes again!
Glaciation starts in Hudson Bay
August 13, 2015: 2nd highest ice coverage for Hudson Bay since 1971 at mid-August – only 1992 higher
The sea ice on 25 July 2015. (Note the location of the Great Lakes and think of the record ice the last couple of winters and the 6F below normal summer water temperature.)
https://polarbearscience.files.wordpress.com/2015/07/hudson-bay-breakup-july-25-2015_cis.gif
Yeah, Sure, this was the Record Hottest year.
http://www.webweaver.nu/clipart/img/people/men/rotlmao.gif
Hi – I’m new here. For the record, I believe global w. = hoax.
For me, this was a great article, by the way!! I’m actually VERY interested in doing a comparison of NSDIC graph (that I look at almost daily) and the NOAA graph referenced in IPCC 1990 in the article. Any idea if there is one that is maintained on the net. I saw one similar to NDSDIC on the NOAA site (shall we call it an ‘enron’ graph??) here: http://www.arctic.noaa.gov/detect/detection-images/climate-ice-seaice-extent-trend-sep14.png
There is a visible gap before 1979 – before this article I would’ve assumed it was because there were no reliable records or somefink
Anyways – let me know fi there is a NOAA graph like the IPCC maintained that I can have a look at
Also – what is the difference between (a) and (b) above
Thanks
Dimitri
Climate Change DENIERS will FAIL!
https://twitter.com/HillaryClinton/status/671426754414641152
Hilarity Clinton = cynical
Its the ONLY thing she has in her life.
Monica really F**Ked-up her mind !!!!
Sorry , Hilarity.. but as an anti-CO2 campaign, AGW has FAILED MISERABLY
China, India, and many other developing countries will ENSURE that emissions of CO2 will continue to climb at a steady or ACCELERATING rate, for at least her miserable, cynical life-time.
Here is hoping she follows Maurice Strong’s lead…
I really really can not stand that woman.
Hitlary will be trumped in ’16
Morgan-
I sincerely hope you’re right. But the republican establishment is making it pretty clear that they’d prefer Hilary to Trump. And the media doesn’t even try to hide their hatred. That’s a lot of money and power stacked against him.
Of course, Trump’s ego versus the entire world… That’s a close call. I wouldn’t bet against him.
One of the things Trump has going for him is the hatred the GOPe and the MSM have for him. When they go after him for dinky crap, like: “Donald J. Trump did not correct a man who said President Obama is Muslim, during a town hall event..” (CNN/ NYTimes) they really do come out looking idiotic.
The trust in the MSM is long gone especially among Republicans and Independents. Only 40% of Americans saying they have “a great deal” or even “a fair amount” of trust in mass media in a 2014 Gallop poll. Another poll said 75 percent of Americans don’t think journalists get the facts right. Gallup also found that 44 percent of all Americans consider the news media to be “too liberal”, while only 19 percent of all Americans consider the news media to be “too conservative” The big networks are losing viewers too. Nielsen Media Research data show that the biggest decline came with MSNBC, which lost nearly a quarter (24%) of its prime-time audience. CNN, under new management, ended its fourth year in third place, with a 13% decline in prime time. Fox, while down 6%, still drew more viewers (1.75 million) than its two competitors combined (619,500 at MSNBC and 543,000 at CNN) http://www.econmatters.com/2014/10/10-reasons-not-to-trust-mainstream-media.html
This bit was news to me.
It gets even worse when you consider politics.
The republicans have never been a rock solid monolithic political base. Also, at least according to the 2010 Blair-Rockefeller report the Tea Party members are not stupid, they are well educated and they are politically savvy.
AMO Rules the Artic: http://www.woodfortrees.org/plot/esrl-amo/from:1900
Lowest point at 1979 and rising since.
Now on a turn to the cold side.
If you search back in some recent threads you will find some charts that show the power of the AMO when it comes to Arctic sea ice.
There’s a post somewhere where I explain that Arctic sea ice level is actually a bit HIGH for this stage of the AMO.
Sorry bed time down here. good hunting.
Andy here is the link to your comment on Arctic Ice and AMO
You forgot to post the data that implies that sea ice area is “cyclical”. Again, simply claiming something does not prove it.
The AMO is cyclical, not “cyclical”. I’m not going to post data.
You are a moron, not a “moron”. Actually you are a *moron* and perhaps a MORON.
The Atlantic Multidecadal Oscillation
http://appinsys.com/globalwarming/AMO_files/image002.gif
NOAA:
Again, cfdopey displays his abject ignorance of all things to do with climate.
Well done.. I didn’t think even you could keep doing it.
I am not doing it for him. I am doing it to show just how ‘dopey’ the trolls are.
I should also add I put up this stuff mainly for the people who are interested and trying to get a handle on climate.
I appreciate your efforts. I started out giving Gore’s dvd to family and friends. It was evil folks like you, who provided factual information that first led me toward my eventual process of disillusionment about man-made global warming. Please bear with me as I borrow your devil smile now…
https://media2.stickersmalin.com/produit/100/stickers-devil-smile-R1-143760-2.png
Disillusioned,
It is nice to know that those of us who try to put out decent information do have an impact.
Thanks
Devil smile??? I always thought Gail was just a KISS fan.
Actually I really like the group Clam Chowder.
HMMMmm I bet she is talking about ‘bend over greek sailors’…
Gail, I assure you that folks like you DO have an impact. You’re not just preaching to the choir. Although it is slow, there is attrition – believers are losing ground. (It’s a shame, as AGW falls apart even further, the shrill in the media and from our fascist leaders gets louder.) That’s to be expected, I guess.
I read more than contribute, and very much enjoy reading your posts here, as well as some other knowledgeable contributors.
(Ted, hover your mouse over the image and look a the URL at the bottom of your screen – or click on the image)
“Well done.. I didn’t think even you could keep doing it.”
What I meant to type was..
Well done.. I didn’t think even he could keep doing it.
I was thinking that surely, even for him, stupidity is limited…. but apparently not !
Why is the AMO in control of the Arctic ice melt?
It is pretty simple. Warm water from the Gulf Stream makes it’s way into the Arctic.
http://www.bigmarinefish.com/map_currents_atlantic.jpg
http://90-north.com/wp-content/uploads/2013/05/Arctic_Ocean_circulation_diagram.jpg
The density of ice is 0.92 g/mL, and the density of water is 1.0 g/mL or 1.03 for salt water. This means that ice has nine-tenths, or 90 percent of water’s density and therefore around 90 percent of the iceberg is below the water’s surface sitting in water from the Atlantic ocean.