
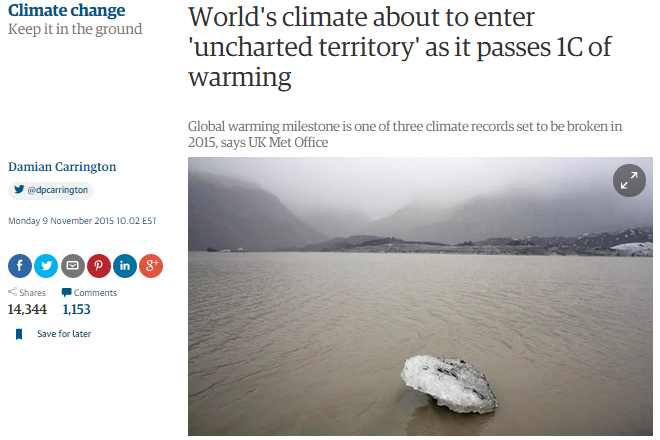
Here is a new stunner in the world of government climate fraud. The UK Met Office is claiming that 2015 temperatures are above 1C warming for the first time, due to human influence.
Global temperatures set to reach 1 °C marker for first time – Met Office


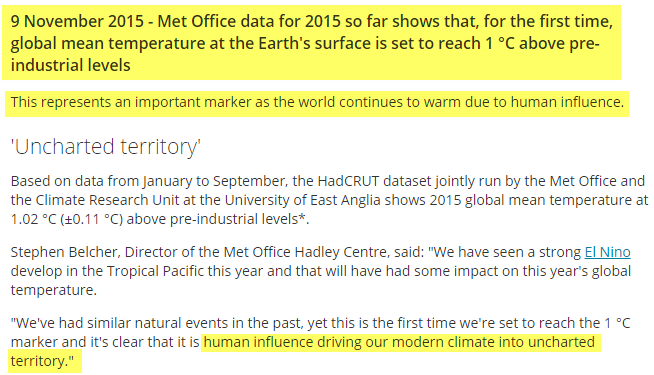
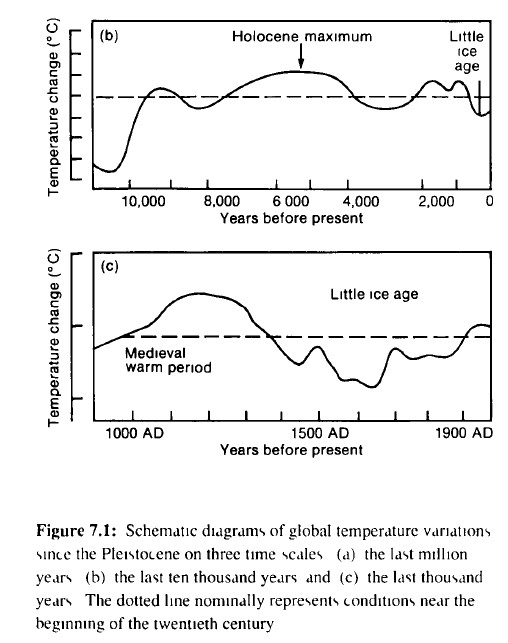
The 1990 IPCC report showed that temperatures are still well below pre-industrial levels.
They also showed more than 1C warming in 2012
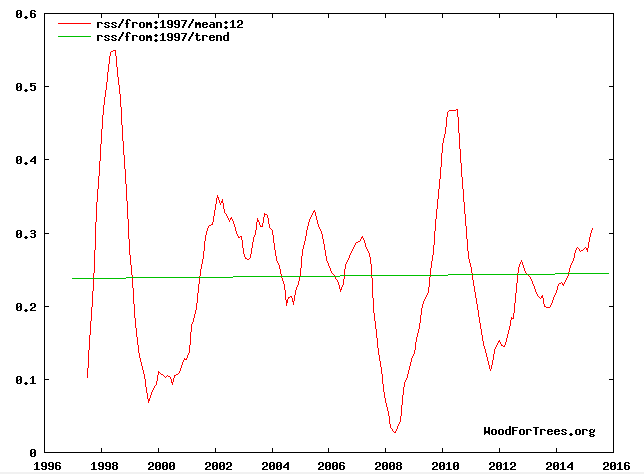
And they completely ignored satellite data which shows Earth cooling this century, not warming as The Met Office claims.
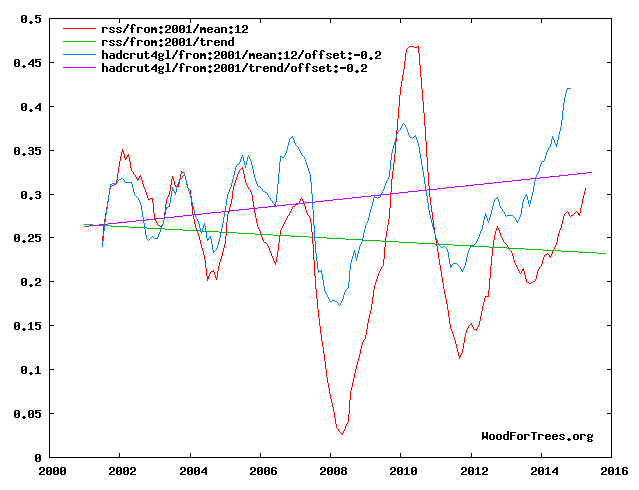
Temperatures this year are nowhere near record warmth.
The entire basis of their claim is fraudulent, except for the “human influence” part. The human influence being ongoing fraud. And of course their partners in crime at the Guardian have picked up on this without doing any checking.

Not a single paper exists that refutes natural variability as the driver of global climate change, and yet the grantologists and their enablers are certain man is to blame.The fraud runs deep and wide.
And our Soros funded, Marxist Studies Major is dutifully repeating this misinformation to the masses… http://makewealthhistory.org/2015/11/11/halfway-to-2-degrees/
Well seeing as his pathetic site only gets 1.1k views a day, not so much with the masses. LOL…
http://www.easycounter.com/report/makewealthhistory.org
What? No Veterans Day post?
Make wealth history? Destroy wealth, is that tge meaning?
Of Course. The whole objective is to destroy the middle class since we challenge the elite.
“Global Sustainability requires the deliberate quest of poverty, reduced resource consumption and set levels of mortality control.” – Professor Maurice King
to get up to their 1.02 figure; Oct, Nov & Dec will each need to be ~ twice as hot as August… looking forward to that !!
Never mind that there’s very likely been much larger variations (up and down) throughout Earth’s history, without any human influence whatsoever. Also nevermind that much larger changes were predicted, and never eventuated.
Their claims are certainly only for the extremely gullible. Sadly, that includes many in power.
Dave, the surface record is FUBAR. Currently the entire troposphere is about .25 degrees cooler then the fabricated surface record, and nowhere close to a record.
If I am recollecting accurately, in order for their to be enhanced greenhouse effect warming, the troposphere has to be warming at least 30% faster than the surface. Clearly, that is not occurring.
FROM NOAA:
https://www.ncdc.noaa.gov/paleo/abrupt/images/data3-gisp2-icecore.gif
Pretty easy to get a 1C increase when they use the coldest part of HadCRUT as their reference period …. 1850-1900. 😉
They need to replace there photo with this one:
http://i.dailymail.co.uk/i/pix/2014/01/17/article-2541327-1ABDDAD500000578-825_634x675.jpg
After all Britain faces longest winter in 50 years after earliest ever arrival of Siberian swan
And then there is the increase in remaining snow patches in Scotland. They are way up since last year when the BBC wrote Glacier-like hazards found on Ben Nevis: … they have come across compacted, dense, ice hard snow call neve. Neve is the first stage in the formation of glaciers, the team said.
Snow patches in Scotland have nearly doubled since that BBC article was written
https://weatheraction.files.wordpress.com/2015/08/wpid-scottish_snow_patches_20150827t140213.jpg
The Alarmists must be getting frantic!
https://3.bp.blogspot.com/-7BTnRqeqVxo/Usw2ugazZ8I/AAAAAAAA2Vw/Up68eQgj6Aw/s320/mother_nature_denies_global_warming.jpg
Someone need to update that cloud sign to “18.5 years” (or is it 18.8 now?)
Steven, your graph from the first IPCC report is wrong. It was removed from that report ass soon as it was determined to be wrong. You know that, so you are being especially deceitful here.
“We need to get some broad based support, to capture the public’s imagination…
So we have to offer up scary scenarios, make simplified, dramatic statements
and make little mention of any doubts… Each of us has to decide what the right balance
is between being effective and being honest.”
– Prof. Stephen Schneider,
Stanford Professor of Climatology, lead author of many IPCC reports
They would never remove a graph because of their desire to be effective rather than honest, Stephen said so…
That sound like the sort of crap that Martin would write.. (2014)
“We need a database of current states of climate arguments. Skeptical Science is basically that database, but we need a canonical name for each argument and a summary of the current state of the argument, plus the list of papers and datasets that are used to establish the current state of the argument, and finally, the list of papers that are refuted by the current state of the argument.
Then the rule for moderation can be: If your post argues against the current state of some climate argument, your argument most not be one that has been refuted.
The whack-a-mole strategy is what must be prevented from obscuring the current state of climate science.”
Truly hilarious spew, worthy only of a very base level Gore bot.
“….Truly hilarious spew, worthy only of a very base level Gore bot.” Who is desperately hoping someone else will do his homework for him.
It occurs to me that what you have are people like us who are curious and willing to work and think.
On the other side you have the lazy SOBs who are hoping someone else will do their work for them. Of course they are liars and Ass Kissers, and the top tier are multi-billionaire sociopaths, but all in all the motivation is power and $$$ not knowledge.
If the playing field was level we would win hands down. Unfortunately they grabbed control of the money machine and then the economy and all the resources and yet they still have a hard time defeating us.
Can you link us to the papers that refute the older graph? I don’t mean papers that disagree with it. I mean papers that show the errors in the older data.
I am guessing the answer will be either silence or no.
No Jason,
It looks like Martin went running home to get one of the “Big Guns” to bail him out.
This response also answers the question about whether or not the skeptic blogs are closely watched by Alarmist Central.
Ted, Jason, Gail, the general level of immaturity shown by commenters here is astonishing.
Martin you were asked simple questions regarding an assertion you made. How is the graph wrong? Who said it was wrong besides you? Your answer, crikets.
Now the lamb graph has some criticism due to its sparseity, but has sense been backed by numerous peer reviewed reports. There Martin,did your homework for you, and sorry martin, no cookies for you your deception.
The paper refuting it were discussed in the climategate mails.
The story is simple.
Folland put the graph in by mistake
As Jones explained to people the paper refuting the diagram was published in an obscure journal to spare Hubert Lamb the embarassment of being wrong.
The diagram was wrong.
It was wrongly included
the story of how the paper refuting it was “hidden” is an untold story in climategate..
oh wait.. I’ve told you people this a good number of times
“Folland put the graph in by mistake”
I find that easy to believe, since 97% of the content of the IPCC reports were put in by mistake as well.
Ted, the two graphs are hand drawn. There is no scale on the Y-axis of either of them. There are no papers refuting the graph because nobody writes a scientific paper to “refute” a graph that has no basis in fact to begin with.
The graphic was never wrong, just disputed due to lack of sample size. it has since been backed by many peer reviewed reports.
no David.. the graph is from grey literature.
The graph from the IPCC was NOT wrong, and having a base-level Gore bot say it is wrong is totally meaningless.
It was removed because it was contrary to the fraud they wanted to perpetrate.
the “graphic” goddard uses was in fact grey literature.
FROM THE CLIMATEGATE MAILS:
‘I may have inadvertently had a hand in this millennium graph! I recall getting a fax
from Jack with a hand-drawn graph, that he asked me to review. Where he got his version
from, I don’t know. I think I scribbled out part of the line and amended it in some
way, but have no recollection of exactly what I did to it. And whether he edited it
further, I don’t know. But as it was purely schematic (& appears to go through ~1950)
perhaps it’s not so bad. I note, however, that in the more colourful version of the
much embellished graph that Stefan circulated ([1]
http://www.politicallyincorrect.de/2006/11/klimakatastrophe_was_ist_wirkl_1.html
the end-point has been changed to 2000, which puts quite a different spin on things.
They also seem to have fabricated a scale for the purported temperature changes. In any
case, the graph has no objective basis whatsoever; it is purely a “visual guess” at what
happened, like something we might sketch on a napkin at a party for some overly
persistent inquisitor….. (so make sure you don’t leave such things on the table…).
What made the last millennium graph famous (notorious!) was that Chris Folland must have
seen it and reproduced it in the 1995 IPCC chapter he was editing. I don’t think he
gave a citation and it thus appeared to have the imprimatur of the IPCC. Having
submitted a great deal of text for that chapter, I remember being really pissed off that
Chris essentially ignored all the input, and wrote his own version of the paleoclimate
record in that volume.”
Phil Jones wrote:
>
> Tom, Caspar,
> Keep the attached to yourself. I wrote this yesterday,
> but still need to do a lot more. I added in a section
> about post-Lamb work in CRU, but need to check out
> the references I’ve added and look at the extra one
> from 1981 that you’ve sent. This may take me a little
> time as I’m away Weds/Thurs this week. I see my name
> on an abstract, by the way, that I have no recollection of !
> I presume this has something in about instrumental global
> temps. This abstract isn’t in my CV!!!!!
>
> So your point (3) needs to document that we knew the
> diagram wasn’t any good, as well as how far back it goes.
> Knowing Hubert on some of his other ‘breakthroughs!’
> it is clearly possible it goes back to Brooks !
>
> On the post-Lamb work in CRU, I recall talking to Graham
> (maybe mid-1980s) when he was comparing recent CRU work
> with Lamb – correlations etc. Did that ever see the light of day
> in these pubs or elsewhere? I will look. It isn’t in the chapter
> Astrid and he wrote in the CRU book from 1997. I recall some
> very low correlations – for periods from 1100 to 1500.
>
> This is all getting quite complex. It clearly isn’t something that
> should be discussed online on RC – at least till we know all
> the detail and have got the history right as best we can. A lot
> of this history is likely best left buried, but I hope to summarise
> enough to avoid all the skeptics wanting copies of these
> non-mainstream papers. Finding them in CRU may be difficult!
>
> As for who put the curve in – I think I know who did it. Chris may
> be ignorant of the subject, but I think all he did was use the
> DoE curve. This is likely bad enough.
> I don’t think it is going to help getting the real culprit to
> admit putting it together, so I reckon Chris is going to get the blame.
> I have a long email from him – just arrived. Just read that and he
> seems to changing his story from last December, but I still
> think he just used the diagram. Something else happened on
> Friday – that I think put me onto a different track. This is all like
> a mystery whodunit.
>
> In the meantime – any thoughts on the attached welcome. Getting the
> level of detail required is the key.
>
> I need to do a better diagram – better scanning etc.
>
> Cheers
> Phil
> At 18:02 06/01/2007, Tom Wigley wrote:
>> Phil,
>>
>> I see the problems with this in terms of history, IPCC image,
>> skeptix, etc. I’m sure you can handle it. In doing so, you might
>> consider (or not) some of these points.
>>
>> (1) I think Chris Folland is to blame for this. The issue is not
>> our collective ignorance of paleoclimate in 1989/90, but
>> Chris’s ignorance. The text that was in the 1990 report (thanks
>> for reminding us of this, Caspar) ameliorates the problem
>> considerably.
>>
>> (2) Nevertheless, ‘we’ (IPCC) could have done better even then.
>> The Rothlisberger data were available then — and could/should
>> have been used.
>>
>> (3) We also already knew that the Lamb UK record was flawed.
>> We published a revision of this — but never in a mainstream
>> journal because we did not want to offend Hubert. I don’t have
>> the paper to hand, but I think it is …
>>
>> Wigley, T.M.L., Huckstep, N.J., Mortimer, R., Farmer, G., Jones, P.D.,
>> Salinger, M.J. and Ogilvie, A.E.J., 1981: The reconstruction of European
>> climate on decadal and shorter time scales. (In) Extended Abstracts,
>> First Meeting, Reconstruction of Past Climates Contact Group, EEC
>> Directorate-General for Science, Research and Development, Brussels,
>> Belgium, 8384.
>>
>> It could be …
>>
>> Wigley, T.M.L., Farmer, G. and Ogilvie, A.E.J., 1986: Climate
>> reconstruction using historical sources. (In) Current Issues in Climate
>> Research (eds. A. Ghazi and R. Fantechi), D. Reidel Publishing
>> Company, Dordrecht, Netherlands, 97100.
>>
>> The point of this paper (whichever one it is) is that it covers only
>> the decadal variation — but it shows that Lamb was out to lunch
>> even on these time scales. As you know, this arose from his uncritical
>> use of historical sources — a problem exposed in a number of CRU
>> papers in the 1980s, staring with Bell and Ogilvie in Climatic Change.
>>
>> So part of the issue is where did Hubert get the century time scale
>> changes in that diagram? The answer is, mainly from his own fertile
>> imagination. For this he tried to synthesize both his flawed historical
>> record for England (and records for Europe, equally flawed) and
>> proxy data from many sources, again accepted uncritically. Still,
>> there almost certainly was a LIA in Europe in the 17th/18th
>> centuries (but not in Iceland — at least not in the 17th century).
>> Whether or not there was a significant centuries-long MWE is
>> doubtful in my view.
>>
>> On another historical note, Hubert got many of his ideas from
>> C.E.P. Brooks — possibly Brooks’s work is what inspired Hubert
>> to pursue his climate interests. Of course, he went a lot further
>> (too far) because he had a lot more information to work with.
>> However, it is interesting that Fig. 33 in Brooks (1928) looks a
>> lot like the IPCC90/Lamb Figure — in Brooks the record goes
>> back further, and there is a very warm period from about 500
>> to 950AD.
>>
>> You should be careful about using “recovery from the LIA” to
>> explain warming after the Maunder Minimum. It is easy to show
>> with (e.g.) MAGICC that there is no such thing — especially if
>> you accept the view on low-frequency solar forcing espoused
>> in the recent Foukal et al. paper in Nature. If you want some
>> support for this (i.e., the spurious recovery idea) I can send you
>> a diagram.
>>
Enjoy this page
http://technocracy.news/index.php/2015/10/30/former-president-of-greenpeace-scientifically-rips-climate-change-to-shreds/
All those e-mails do is say that 17 years later (06/01/2007) the graph AND THE TEXT which I quoted were an embarrassment and the ClimAstrology Team™ were trying to figure out the best way to bury it.
At the time Dr Lamb (1913-1997) was ten years dead so could provide no correction.
What is missing from that set of e-mails is the timing.
1. The original hockey stick graph of Mann, Bradley & Hughes was from 1999.
2.A version of the hockey stick graph was featured prominently in the 2001 IPCC Third Assessment Report (TAR).
3. In 2003 Soon and Baliunas published a paper refuting the Hockey Stick and as a result there was a big blow-up in the Bush Admin, the EPA and the journal editors were fired.
Soon, Wille; Baliunas, Sallie (31 January 2003), “Proxy climatic and environmental changes of the past 1000 years”
4. The 2003 Soon and Baliunas paper was followed by McIntyre and McKitrick showing that ‘phone numbers from a phone book’ would produce a Hockey Stick using Mikey Mann’s methods.
After this McIntyre and McKitrick were making presentations from 2004 to 2008 to National Academy of Sciences, House Energy and Commerce Committee, Royal Institute of Technology, Royal Dutch Meteorological Institute… link
The entire Con Game was unraveling. People were microscoping all the data and that ‘Lamb’ graph and the text in FAR stood out like a sore thumb because it refuted Mikey’s Hockey Stick also. The ClimAstrology Team™ HAD to get rid of it or Mike Mann and the rest of them who had contributed would look like absolute FOOLS. Even more important the Copenhagen Summit (2009) was on the horizon and they HAD to have everything swept under the rug before then.
So history got rewritten. Dr Lamb was dead and the ClimAstrology Team™ was busy rewriting history anyway so what’s one more piece?
All this does is show MORE FRAUD!
FRAUD which MoshPit, being the salesman for the Best lemon, absolutely has to support.
Steven Mosher says: “As Jones explained to people the paper refuting the diagram was published in an obscure journal to spare Hubert Lamb the embarassment of being wrong.”
Gail says: “At the time Dr Lamb (1913-1997) was ten years dead so could provide no correction.”
There is nothing worse than being both dead AND embarassed. Thank goodness Dr Lamb was at least spared that.
Jason,
There is something much worse. Being a dead lying Warmist residing in Dante’s Ninth Circle of Hell.
The deepest, darkest circle of hell is reserved for the very lowest form of human existence the traitor. Satan himself resided in the center of this Hell chomping on the traitors heads. To Dante the traitor is an even lower form of entity than a murderer, mass murder, sodomite, or usurer. The Traitor sell their souls, and have betrayed their principles, their kin, their fellow man, their country, and even the gods themselves.
From Tacitus the ancient Roman historian to modern times the Traitor is the most hated of humans.
I am an Agnostic but more and more I hope Dante’s description of what awaits the traitors among us is correct.
Hey Gail,
“And so it was in the days of NOAA that the heavens did open up and rain-drought flooded the surface of every nation that did not have data put forth. And the frozen reaches of the poles began to vanish as they melted at 40 degrees below zero. And in the south, those oceans with no thermometers did boil and seethe with the errors of their sceptical minions. And lo! even the Lamb, Dr. Hubert himself, was defamed as he lay in the very halls of Death itself. And so it was that the warmists celebrated mightily, not knowing that those true of knowledge and firm in their faith of science would rise from Heller and walk forth into the clear and radiatively normal air of the Earth!”
Book of Jason, Chapter 2, verse 11
Oh well… I can dream, can’t I? 🙂
Love it Jason!
>>>>>>>>>>>>
The Martin Troll wonders why we are so ‘Unwelcoming’
For one, I think we are all sick to death of the years and years of fighting for the scientific method to be honored So we are a bit short tempered when someone spews the same Bull feces we have heard a hundred times before.
Also we have all read the Rules for Radicals. This is the one they want to use on Christians.
RULE 4: “Make the enemy live up to its own book of rules.”
Not being a Christian, I see no reason to be polite to a person I consider a traitor and even the Bible is not very nice when speaking of traitors.
Seems nobody likes a traitor.
Yeah, it has been disappointing dealing with Martin. He just repeats the same accusations over and over and claims that the adjusted data must be right because it has not been proved to be otherwise. Of course science does not work that way, but he still claims to support science. I really do believe that Martin has the ability to reason and think logically — but he refuses to do so. I have no idea what his motivation is; I can only guess that it is one of two things. Either he has some very sad personal need to stir up discord, or he is actively being rewarded in some manner. It is a darn shame. He could do better.
Hey Jason! I have no problem dealing with those who are ignorant of facts, what I truly cannot tolerate is willful ignorance like that displayed by Marty. Refusal to acknowledge facts and logic, is to me a mortal sin, and deserves all the derision I can dish out. Especially when it comes at the cost of seven million lives each year.
The Magical appearance of the Mosh Pup makes me lean towards paid low level troll.
I am very cynical when it comes to ‘Activists’ after seeing the ads in the Boston Globe for Activists to protest Seabrook Nuclear Power Plant in 1984. They were paying $10.00/hour when the minimum wage was $3.35. Heck in 2004, twenty years later we were paying lab techs $10.00/hour.
https://www.youtube.com/watch?v=R46X3J7ZFuk
You miss the POINT
They never expected these 2007 mails to be READ
The mails detail that the chart was a mistake
So, start by admitting that
MAGICC…… ROFLMAO 🙂
You funny boy Mosh/Jones.
“MAGICC is a coupled gas-cycle/climate model. It has been used in all IPCC reports to produce projections of future global-mean temperature and sea level …”
nuff said. !!
We all know these projections and BOGUS, and proven by REAILITY to be WRONG!!!
The issue is the chart was wrong.
ADMITTED WRONG IN SECRET MAILS.
yawn..
You are poor salesman.. crawl back under your rock.
The lamb graphic has sense been verified by numerous peer reviewed publications. Go to th NIP report to see a list of them. Quotes from a bunch of biased CAGW enthusiasts making false assertions foes not bolster a story. The graph was not wrong, just the data at the time was to sparse. Just as the data for all CAGW alarmists projections is not only to sparse, but not even backed by the observations.
There are no numbers on the Lamb graphic.
There is no definitive source
NO DATA. NO CODE. NOT SCIENCE.
It has more scientific merit than the BS your team is pushing. The same team that wants to deny the MWP and LIA.
Care to try again for that paper I requested? 😆
We’ve got to ride this global warming issue.
Even if the theory of global warming is wrong,
we will be doing the right thing in terms of
economic and environmental policy.”
– Timothy Wirth,
President of the UN Foundation
~~~~~~~~~~~~~~~~~~~~~~~~~~~~~~~~~~~~~~~~~~~~~~~
“No matter if the science of global warming is all phony…
climate change provides the greatest opportunity to
bring about justice and equality in the world.”
– Christine Stewart,
former Canadian Minister of the Environment
~~~~~~~~~~~~~~~~~~~~~~~~~~~~~~~~~~~~~~~~~~~~~~~
“The data doesn’t matter. We’re not basing our recommendations
on the data. We’re basing them on the climate models.”
– Prof. Chris Folland,
Hadley Centre for Climate Prediction and Research
~~~~~~~~~~~~~~~~~~~~~~~~~~~~~~~~~~~~~~~~~~~~~~~
“The models are convenient fictions
that provide something very useful.”
– Dr David Frame,
climate modeler, Oxford University
~~~~~~~~~~~~~~~~~~~~~~~~~~~~~~~~~~~~~~~~~~~~~~~
No the graph wasn’t wrong it just did not support the political position like Mikey Mann’s Hokey Stick so it got pulled.
Medieval Warm Period found in 120 proxies. Plus Roman era was similar to early 20th Century
The graph was wrong. It was copied in as a cut and paste and never should have been in the report. You know this, so you, too, are being especially deceitful.
Rewriting history are we?
nope he is telling the real story.
I can see you havent read the climategate mails.
He’s trying to a lemon.
That’s he ever does.
Can you provide a link to where the IPCC admitted their mistake in presenting that graph, and explained the nature of the evidence used to remove it? Each report they produce is probably the most heavily peer reviewed document in history, to that point. If such scrutiny didn’t reveal the error you claim, then either your claim is false, or the peer review process is deeply flawed. There are no other possibilities.
Crickets……..
Martin, the Pigeon Alarmist, has left his droppings and flown off.
You will find the ‘admission” in climategate mails.
There was a history behind
A) how the graph was produced
B) how it got in the report
C) how the papers refuting it were ‘buried’ to protect lamb
This is “history” than Jones wanted buried
‘> This is all getting quite complex. It clearly isn’t something that
> should be discussed online on RC – at least till we know all
> the detail and have got the history right as best we can. A lot
> of this history is likely best left buried, but I hope to summarise
> enough to avoid all the skeptics wanting copies of these
> non-mainstream papers. Finding them in CRU may be difficult!”
The process is flawed. They admitted this in the climategate mails in 2007
that would be decades after the report was written.
We all know the history Jones wants to bury.
Just look at all his manic adjustments to past data.
Used cars suit you better, Moshpit.
You know you are close to the truth when MoshPit turns up and tries to sell you a lemon.
https://coloradowellington.files.wordpress.com/2015/11/troll-wrong-graph.jpg
The IPCC put the graph on double secret probation!
https://www.youtube.com/watch?v=1tfK_3XK4CI&feature=player_detailpage#t=70
That’s nice.
Steven Mosher is co-author of “Climategate: The Crutape Letters” and works as an independent consultant in the San Francisco area. He attended Northwestern University where he graduated with honors and BA’s in both English Literature and Philosophy.
http://berkeleyearth.org/team/steven-mosher/
Gees Gator, are you saying he has no education WHAT-SO-EVER in anything to do with science.
One would never have guessed, 😉
I hear he headed some teams trying to sell stuff of dubious quality..
Eng/Lit…………….. PROPAGANDA and MISINFORMATION !!. !!!!
Thing is, anyone with even the most basic scientific education can see the farce and scientific ignorance oozing from everything he ever typed.
Your are WRONG.
You a LYING, DECEITFUL Gore operative with no proof of anything you have said since you first slimed onto the blog.
If my memory is correct, ‘that graph’ was reproduced from a series of graphs taken from a peer reviewed paper written by H.H. Lamb, founder of the UEA-CRU.
I think your are correct. I don’t have a link to prove it though.
From what I can dig out it is in FAR on page 202.
http://www.ipcc.ch/ipccreports/far/wg_I/ipcc_far_wg_I_chapter_07.pdf
It is supposedly from data from Dr. Lamb:
Lamb, H.H. 1977. Climate, present, past and future. Volume 2. Climatic history and the future. Methuen & Co Ltd., London, 835 pp.
and there is a reference in FAR:
The text around Figure 7.1 shows that as usual Martin is dropping Alarmist Pigeon feces.
…The period since the end of the last glaciation has been characterized by small changes in global average temperature with a range of probably less than 2 C (Figure 7.1) though it is still not clear all though whether all the fluctuations indicated were truly global. However, large regional changes in hydrological conditions have occurred….
There is growing evidence that worldwide temperatures were higher than at present during the mid-Holocene (especially 5000 – 6000 BP) at least in summer, though carbon dioxide levels appear to have been quite similar to those of the pre-industrial era…
The late tenth to early thirteenth centuries (about AD 950-1250) appear to have been
exceptionally warm in western Europe, Iceland and Greenland (Alexandre 1987, Lamb, 1988) This period is known as the Medieval Climatic Optimum China was, however, cold at this time (mainly in winter) but South Japan was warm (Yoshino, 1978) This period of widespread warmth is notable in that there is no evidence that it was accompanied by an increase of greenhouse gases…
These are some of the other Lamb papers:
Lamb, H.H. Climatic changes: the development of knowledge problems of assessing trends, causes & human impact. [MS].
Lamb, H.H. The variations of climate over the past 2000 years and their relation to history.
1979.
Lamb, H.H. On the frequency and patterns of variation of climate. To be presented at the
Conference called by the Rockefeller Foundation at Bellagio 5-7 June 1975.
Lamb, H.H. Lecture to the Institute of Fuel at the Royal Institution. Long-term weather
patterns and energy. 1979.
Lamb, H.H. Meteorology, climatic changes and history. 1987. [MS].
Lamb, H.H. The future of the earth – greenhouse or refrigerator? Norwich : British
Association, 1984. [MS].
Lamb, H.H. Climatic changes in recent times, the possible influence of human activities and the outlook for the future. Lecture given to Philips Lamps, (1979 : Eindhoven). [MS].
Lamb, H.H. & R.H. Clements, Climatic changes, 1967. [Reprint from Proc. Instn Civ. Engrs].
No,
See the climategate mails. the graph was grey literature.
Mosher.. ex used-car sales man. Still hired by BEST as a low-end salemen to sell their lemon..
Steven Mosher says:
November 12, 2015 at 1:10 am
No,
See the climategate mails. the graph was grey literature.
—————————————————————————————
Asking a lot to get anyone with a little familiarity with those e-mails and the way that situation played out to believe anything those people said or say or to have any confidence in the accuracy of anything they say or do.
The graph was wrong? You can use any of these then:
http://www.hyzercreek.com/MWP-LIA.jpg
The graph was wrong.
In their private emails of 2007 Jones, wigley and others all admit the graph was wrong.
Grey literature included by Folland.
The papers refuting the work were published in obscure journals to “protect” lamb.
The did not dispute lamb period, they criticized it for being sparse, just as their critical papers were. many papers since support lamb.
Nope.. Graph was wrong
here is what they said in secret
“‘I may have inadvertently had a hand in this millennium graph! I recall getting a fax
from Jack with a hand-drawn graph, that he asked me to review. Where he got his version
from, I don’t know. I think I scribbled out part of the line and amended it in some
way, but have no recollection of exactly what I did to it. And whether he edited it
further, I don’t know. But as it was purely schematic (& appears to go through ~1950)
perhaps it’s not so bad. I note, however, that in the more colourful version of the
much embellished graph that Stefan circulated ([1]
http://www.politicallyincorrect.de/2006/11/klimakatastrophe_was_ist_wirkl_1.html
the end-point has been changed to 2000, which puts quite a different spin on things.
They also seem to have fabricated a scale for the purported temperature changes. In any
case, the graph has no objective basis whatsoever; it is purely a “visual guess” at what
happened, like something we might sketch on a napkin at a party for some overly
persistent inquisitor….. (so make sure you don’t leave such things on the table…).
What made the last millennium graph famous (notorious!) was that Chris Folland must have
seen it and reproduced it in the 1995 IPCC chapter he was editing. I don’t think he
gave a citation and it thus appeared to have the imprimatur of the IPCC. Having
submitted a great deal of text for that chapter, I remember being really pissed off that
Chris essentially ignored all the input, and wrote his own version of the paleoclimate
record in that volume.””
You are a poor salesman.. because everyone knows that’s all you are.
Yes, The Mosh Pup is using e-mails from a generation later and after Lamb was dead for ten years to say Lamb didn’t use his data (from his papers) to draw that graph.
The claim the graph is no good because it is ‘Grey Literature” is a REAL belly laugh given Donna Laframboise book on the Fourth Assessment Report published in the same year as the e-mails — 2007.
She finds many chapters draw barely more than half their citations, and the whole AR4 draws only about 70 percent, from peer-reviewed sources.
http://www.amazon.com/Delinquent-Teenager-Mistaken-Worlds-Climate-ebook/dp/B005UEVB8Q
Gail, that was priceless. Its really grey all over.
If you work the numbers on IPCC AR5 Figure 6.1 you will discover that anthro C is partitioned 57/43 between natural sequestration and atmospheric retention. (555 – 240 = 315 PgC & 240/555) IMO this arbitrary partition was “assumed” in order to “prove” (i.e. make the numbers work) that anthro C was solely/90% responsible for the 112 ppmv atmos CO2 increase between 1750 – 2011. C is not CO2.
PgC * 3.67 = PgCO2 * 0.1291 = ppmv atmospheric CO2
IPCC AR5 Figure 6.1
……………………………….PgC/y……ppmv/y
FF & Land Use Source…….8.9……….4.22
Ocean & Land Sink…………4.9……… 2.32
Net Sink.……………………..4.0……….1.90
If the anthro 8.9 Pg C/y (4.2 ppmv CO2/y) suddenly vanishes the natural cycle that remains would be a constant sink of 2.3 ppmv CO2/y. Reverse extrapolation (GCMs & RCPs apply forward extrapolation) calculates that 121 years in the past (278 ppmv CO2/2.3 ppmv CO2) or the year 1629 (1750-121) atmos CO2 would have been 0, zero, nadda, zip, nowhere to be found.
Oh, what a tangled web we weave!
The 8.9 Pg of anthro C simply vanishes in earth’s 45,000 plus Pg C cauldron of stores and fluxes. Mankind’s egoistic, egocentric, conceit means less than nothing to the earth, the solar system and the universe.
That is some mighty fine math calculating. Amazing what happens when these “Climate Bibles” are looked at closely.
Thanks, that is a real keeper. BOOKMARKED!
That is one point I never thought of, and I bet the twits at NOAA/NASA/NSIDC et al didn’t either. Pretty much destroys the whole Anthro C argument in a few lines. Wow. Kudos!
Steve has provided information repeatedly that maximum temperatures have not increased for many years and in fact may have decreased. But aren’t increases in the minimum temperatures the primary reason for the claimed warming trend? And don’t most of these increased minimums derive from stations located near urban areas? And if this is the fact, doesn’t that show the claimed warming is only a fictitious artifact or construct of UHI? I don’t believe rural stations have showed the same increase in minimums.
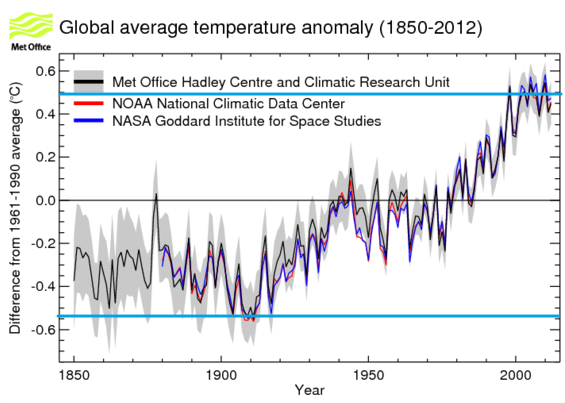
This is the UKMO note on the reference temperature which appears to say that their ‘pre-industrial temperature’ is the average global temperature from 1850-1900.
* While late 19th century temperatures are commonly taken to be indicative of pre-industrial, there is no fixed period that is used as standard and a variety of other periods have been used for observational and palaeo datasets. There are limitations in available data in the early instrumental record, making the average temperature in the reference period less certain. There is not a reliable indicator of global temperatures back to 1750, which is the era widely assumed to represent pre-industrial conditions. Therefore 1850-1900 is chosen here as the most reliable reference period, which also corresponds to the period chosen by IPCC to represent a suitable earlier reference period.
Looking at their global temperature plot it would appear that the average 1850-1900 temperature is around -0.3 0n their scale and Jan 2007 had an anomaly of 0.832 in HADCRUT4 so the 1°C threshold was handsomely exceeded 8 years ago by their standards in similar circumstances (El Niño). Belcher is either a liar, incompetent or badly advised.
PS anyone know what the El Niño situation was before 1871?
No, but hum a few bars and I’ll fake it.
Are you with NOAA? {:>D
Perhaps they really meant 1 degree warmer than when it was 1 degree cooler, or before they adjusted all the historic temperature data up and down by one degree Or, possibly something else…who can tell? The settled science changes so often and so fast that one can’t keep up with it.
That’s very unsettling.
It also helps the Met Office to increase temperatures when their new dataset (HadCRUT4) increases nearly all of the temperatures since 1908 by at least 0.5 °C when compared with their previous dataset HadCRUT3
Correction to my previous post. Should be 0.05 °C and not 0.5 °C.
What is absolutely hilarious is they wait 17 years to remove ONE graph in a report supreceded by three other reports, yet the latest, the 2007 – AR4, was loaded with ~ 30% Gray literature references and mistakes like “Himalayan glaciers could melt away by 2035” and the idiotic ‘findings’ about malaria.
AR4 was so bad “Chris Landsea, chief scientist at the National Hurricane Center, resigned from the IPCC in 2005. He objected to the poor science and politics behind the IPCC hurricane claims.”
Roger Pielke Jr. was so pissed he wrote a paper. It is here on his blog How Many Findings of the IPCC AR4 WG I are Incorrect? Answer: 28%
Yet the Mosh Pup wants us to believe there is ‘scientific motivation’ in the removal of a seventeen year old graph from a report most people have never read and never will read?
https://marvinbarrow.files.wordpress.com/2013/08/laughing-dog.gif
He really must think we are mushrooms!
Checkmate!
Steven “Graph Is Wrong” Mosher wrote a grey literature book, without using any grey matter. The MWP was a hoax, he says, and the only evidence for it is a chart scribbled on a napkin by a drunken pseudoscientist and given an x and y axis by deniers who work for big tobacco.