
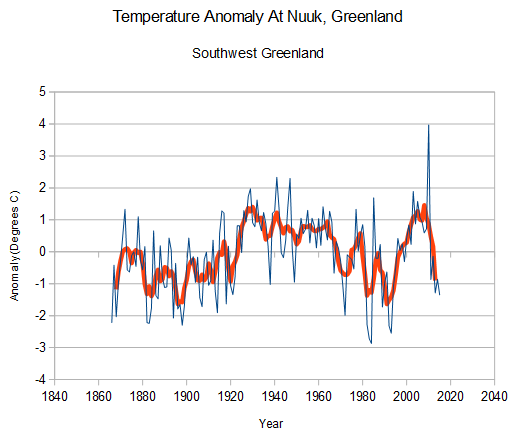
There is plenty of temperature data available from Greenland, but NOAA has made it disappear from their analysis, as has NASA.
They have good reason for this. Temperatures in southwest Greenland are plummeting, and are colder now than during the 1970s. The plot below is made from the NOAA GHCN database – data they pretend they don’t have.
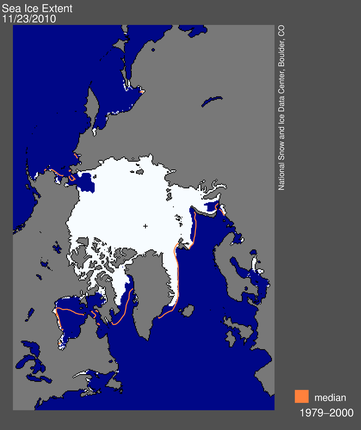
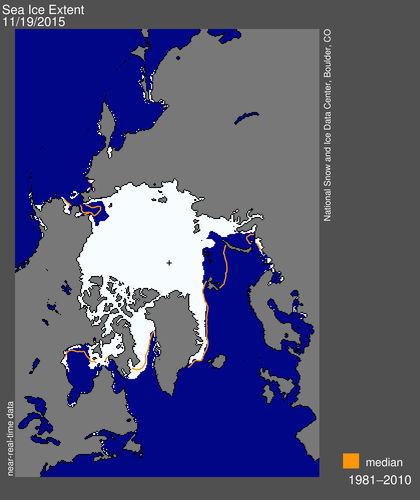
The amount of ice in Baffin Bay has sharply increased since 2010, and is now fully recovered to 1979 levels.
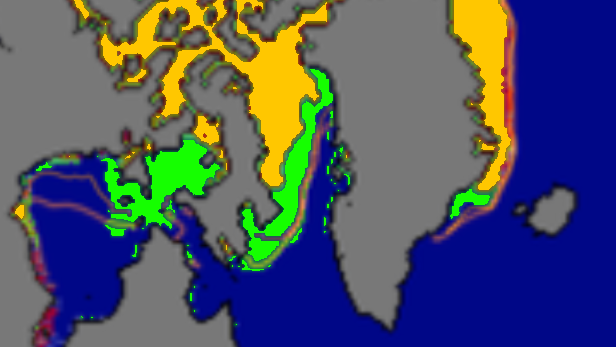
Green below shows ice expansion since this week in 2010.
I took these pictures of Baffin Bay in late June. There was still huge amounts of ice.
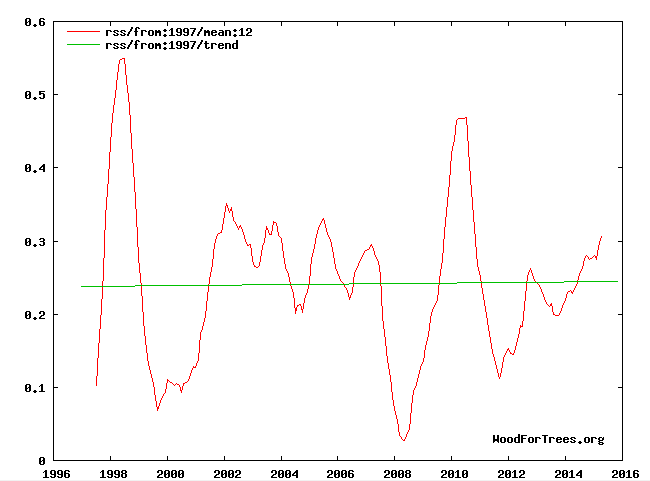
Satellite data shows that 2010 was much warmer that 2015 globally. Satellite data covers almost all of the planet, so it doesn’t produce the gross errors which NASA and NOAA do with their surface data.
Greenland has gone missing, because it wrecks the NOAA/NASA climate scam.

And why would one not suspect that this just an example of what is their standard operating procedure these days. Any location with anonymously cold temps that would ruin their on going hottest ever theme must be altered or failing that omitted from the database.
And people wonder why or even defend the fact that NOAA has defied congress and the law by refusing to hand over their internal communications as if their workers have some kind of executive privilege?
Still I won’t hold my breath that they will comply with the law so the tax payers who fund them can find out the truth about that agencies internal activities. Based on the recent record there is absolutely no reason to believe any agency or department of this administration will follow the law and that this congress has the will, desire, or ability to make them do so.
I now just automatically assume that if NOAA or NASA says it, it must be a lie. I know people that have worked for both agencies and with minimal prompting, they have told me that those agencies are highly politicized and rotten to the core.
I think there are some darn good dedicated people working there but the bosses and and a significant element are totally politically controlled. They don’t have to destroy or eliminate the good ones. They can just move them to other jobs so they can’t interfere with the fraud.
My brother works at NASA, and he has also said that the political pressures are ridiculous and scandalous, forcing him to appear before congress on more than one occasion.
The problem is, the general public, and the media, assume it is the Gospel truth.
The sooner this congressional hearing starts asking questions like this, the sooner those scoundrels fabricating these “temperatures” will be booted out.
What’s the betting that they rediscover these data, after the Paris conference?
There’s a 97% probability they’ll find it down the back of the sofa
Nah! It’s on Hillary’s wiped server.
Where can one find that land only graphic? It’s not in the October report
http://www.ncdc.noaa.gov/sotc/global/201510
http://www.ncdc.noaa.gov/sotc/service/global/map-land-sfc-mntp/201510.gif
http://www.ncdc.noaa.gov/sotc/service/global/map-land-sfc-mntp/201510.gif
sfx, oops – I didn’t mean to post that twice. ;P
Click image for the page
thanks
You can’t compare 11-03 with 11-19.
The comparison is 11-23-2010 vs 11-19-2015
ok
I do love what you do. I found this after an extremely short search:
Greenland Climate Network (GC-Net)
As of the 1999 field season, 18 automatic weather stations (AWS) are collecting climate information on Greenland’s ice sheet. Each AWS is equipped with a number of instruments to sample the following: …
http://cires1.colorado.edu/steffen/gcnet/
But as I’ve posting, I don’t expect to read about it in the “Mainstream” press.
There are others from which you can download data. They haven’t been operating as long as the ones you found:
http://www.promice.org/WeatherArchive.html?stationid=114
The link is for the upper station near 79 Fjord and the Zachariae Isstrom but if you use this link:
http://www.promice.org/CurrentWeatherMap.html
you can see where they all are on a particularly detailed map of Greenland which zooms to some very interesting detail (excellent for names of geographical features that are hard to find elsewhere).
After a longer search I found the ncdc.noaa.gov image
I got the link from Tony’s post here: https://stevengoddard.wordpress.com/2015/11/19/record-crushing-fraud-from-noaa-and-nasa-ahead-of-paris/
Thanks. For a variety of reasons, I like original sources for stuff like that.
Steve, I wasn’t talking about Tony’s link to HIS copy of the image: http://realclimatescience.com/wp-content/uploads/2015/11/201510.gif
I was talking about the link that YOU posted. Below Tony’s image, he provided the link to the original source: http://www.ncdc.noaa.gov/sotc/service/global/map-land-sfc-mntp/201510.gif
It is the blue (or purple, if already clicked on) link named “201510.gif (990×765)”
Disillusioned says:
November 21, 2015 at 4:39 pm
Yes, I followed your link and found the match to what I posted at 3:09pm
Thanks
What I don’t understand is, there’s no data for Greenland on the land only map, but there is on the land & ocean map.
Does that mean the land & ocean map data (for land) is based on ocean data?
I can’t find a link to the ocean only map.
There’s lots of data that isn’t readily available. Besides the ocean map, columnar or table data of sea surface temperatures published now and then, say ten years ago, would be nice.
I’m convinced it used to be easier to find, but i think they have “improved” the site.
Some previous months and years have a few stations shown, some don’t.
http://www.ncdc.noaa.gov/sotc/service/global/map-land-sfc-mntp/201010.gif
http://www.ncdc.noaa.gov/sotc/service/global/map-land-sfc-mntp/201509.gif
(just change the date in the url to check)
Interesting. Dec 2014 was a very cold month for Greenland, but no data shown
http://www.ncdc.noaa.gov/sotc/service/global/map-land-sfc-mntp/201412.gif
Dec 2004 was very very cold for Greenland, but the graphic doesn’t show it
http://www.ncdc.noaa.gov/sotc/service/global/map-land-sfc-mntp/200412.gif
Steven, you are using a map of GHCNM version 3.3.0. The data for Greenland are in ERSST version 4.0.0. This map shows both datasets merged: http://www.ncdc.noaa.gov/sotc/service/global/map-blended-mntp/201510.gif
As you can see, the temperature in most of southern Greenland is above normal.
As you can see, the temperature in most of southern Greenland is above normal.
No, the “massively adjusted” and fake temperatures are slightly above a meaningless and cherry picked average.
…and for some strange reason…their 500 mb map shows the opposite
http://www.ncdc.noaa.gov/sotc/service/global/hgtanomaly-global/201510.gif
http://www.ncdc.noaa.gov/sotc/service/global/map-blended-mntp/201510.gif
Martin, are you that stupid? That is what NOAA CREATED — after their interpolation and extrapolation computer games of the original data (from which there are no such data)! What you’re looking at, NOAA did not record. Your image is of what they made up for Greenland. SHEESH!
It so funny that he continues to display his abject ignorance about… well… everything. 🙂
Yes.. he is that stupid. !!
Mr. Smith, yesterday you said, “No, rah, 2C was never believed or claimed to be a tipping point.” I was wondering if you were lying or just ignorant of the truth.
Just one of multiple sources to prove you wrong, ”Climate scientists frequently warn of the 2C global warming tipping point, saying that if average temperatures rise beyond that threshold, irreversible damage will be done.” http://blueandgreentomorrow.com/2014/07/25/scientists-identify-evidence-of-climate-change-tipping-point/
As I’ve said before.
As an Anti-CO2 crusade, the AGW farce has been an ABYSMAL FAILURE.
CO2 emissions around the world will continue to INCREASE. probably at an accelerating rate.
NOTHING they have tried has done anything, or will do anything, to reduce global CO2 emissions by more than an itsy-bitsy, meaningless amount
No, R. it doesn’t. If you read the abstract of the study, nowhere does it say that 2C is a tipping point. The news article makes the same claim you agree with, but that isn’t evidence that climate scientists claim that 2C is a tipping point. The actual claim is that we should set 2C as the upper limit for AGW so we can AVOID hitting a tipping point. IOW, staying below 2C will allow the world to avoid the tipping point.
And the whole 2C crap is a pure invention with ZERO scientific backing.
Even Shelhummer, the moron that came up with it , admitted as such.
The IPCC uses that number as far as when they think harm will outweigh benefits. Of course, there is no global increase in droughts, floods the rate of SL rise etc…. so far we have only benefits, as in one billion more people eating due to the increase in CO2, the IPCC is propaganda disguised as science..
I don’t think so, David. We are already seeing harm. We aren’t seeing benefits. The items you list are not happening.
Las Vegas shows warming [especially minima] since 1973
this is where they turned desert into oasis
in Tandil, Argentina, minima have fallen, quite dramatically, since 1973
this is where they cut all the trees….
what part of warming’s benefit do you not understand?
I vote we put Martin in a biosphere dome with NO CO2, several packets of seeds and a CO2 scavenger that removes ALL the CO2 he admits. We will leave him for a year to grow his own food.
We can be nice and send Al Gore, Hansen, Schmidt, Jones, Mann et al. to keep him company.
The Gorebot suited up for his year of CO2 free living:
https://www.screenused.com/images/auction_mar14/14712_4.jpg
So report back to us Little Gorebot after your year in Alarmist Utopia.
Once again, Martin doesn’t “think so” without bothering to Google “Co2 greening earth”.
“I don’t think so, David. We are already seeing harm. We aren’t seeing benefits. The items you list are not happening.”
I’ve been wondering for weeks who Marty reminds me of, and with that reply it finally clicked: Marty is the Black Knight! [start at 2:50]
https://www.youtube.com/watch?v=dhRUe-gz690
Martin Smith says:
November 22, 2015 at 1:27 pm
I don’t think so, David. We are already seeing harm.
====
Martin, can you describe to me exactly what harm?
…and how global warming does that without affecting temperature?
True, but Martin Smith didn’t provide evidence that his petulance is the result of increased atmospheric CO2 concentrations. The null hypothesis stands:
Smith would be the same under 290-350 ppmv.
You are just a liar then. Thanks for more proof.
You are a liar Mr. Smith, proven over and over again.
“We are already seeing harm. ”
BULLSH*T !!! Yet again.
There is absolutely nothing untoward happening with the climate..
We are NOT seeing any harmful benefits linked to atmospheric CO2, because there has been no warming that can be linked to CO2.
The only harm is from the agenda response to the non-issue of “climate change”.
That response is causing unnecessary economic waste throughout the world, leading to hardship for poor people in the western world and stopping 3rd world countries from getting the electrical power that they so desperately need to develop. Its sickening to watch.
There have been massive benefits in food supply and biosphere enhancement though.
” Of course, there is no global increase in droughts, floods the rate of SL rise etc”
David, Martin agrees with you , he says
Martin agrees with you.. He says, “The items you list are not happening.”
First sensible thing you have sever said, Martin.. well done.
Martin, ERSSTv4 is an index of sea surface temperatures derived from buoy and ship readings. It does not use any land based data.
And has it got the “Karl” fictional adjustments in it !!
I understand that Karl, but the two datasets merged together allow for skillful infilling. However, we now know that GISS decided to publish the result for October before receiving temperature data from Greenland. The data will be updated when that data arrives. It may have arrived already.
“together allow for skillful infilling.”
BULLSH*T
They allow for unskilful fabrication.
And learn to spell, you ignorant little Goreboy.
But let’s pre-empt the LIARS at GISS. Here’s the October temps for Nuuk
http://postimg.org/image/x84sbs5db/
And here I’ve done a quick overlay of those temps over the Nuuk averages and deviations.
http://s19.postimg.org/5akkec5kj/Nuuk_overlay1.jpg
You can see that, barring GISS fabrication and lies, the October values will be LOWER than average for both max and min.
first link wrong
http://s19.postimg.org/v3kfap3qr/nuuk_october.jpg
Tom Karl is a liar and you are a liar too, Mr. Smith.
On October 24th, Greenland Summit camp set a new record LOW October temperature
http://iceagenow.info/wp-content/uploads/2015/10/Summit-Station-24-Oct-151.png
Seems that Nuuk is having a heat wave today and tomorrow (Above 0ºC) .
That heat wave is forecast to dissipate over the next fortnight.
http://www.timeanddate.com/weather/greenland/nuuk
And where has that cold air gone ?
http://www.ccma.cat/el-temps/primera-nevada-abundant-al-pirineu/noticia/2697570/
http://news.sky.com/story/952742/sky-news-uk-weather-forecast
Europe.
And the US. Snowing here in central Indiana right now and were under a Winter Weather Advisory until 19:00. Accuweather forecast calls for “near record” low temp for tonight of 15 deg. F. and this front coming down from the top of the globe is heading east.
In my part of the world it seems like generally winter is coming later but lasting later also despite the fact that this snow comes before the traditional start of winter though we are forecast to have temps up into the 50s by Thursday this week once this blast passes.
Let’s see what UAH says for “NoPol” in the last 5 years
http://s19.postimg.org/i7k87yl9v/UAH_No_Pol.jpg
And the last 10 years.. notice the step in 2010.
http://s19.postimg.org/sm42pougj/No_Pol2.jpg
2010 was also the time of a powerful El Nino, that lasted basically the entire year and kind of shifted the entire NP graph backwards by 5 years, but the general cooling trend after the shift remained almost identical.
That’s really interesting, because we had the period of solar maximum, in 2014 and beginning of this year, which seems to have had no important influence on the cooling of the NP.
I believe it is still a bit early to say if the present El Nino will or not have any impact on the NP temps.
note. 5 year graph is to September.. you can see the October 2015 value on the 10 year graph.
http://www.woodfortrees.org/graph/esrl-amo/from:1855/plot/rss/from:1855
http://www.woodfortrees.org/graph/esrl-amo/from:1855/plot/rss/from:1855
hmmm…
Interesting graphs, AndyG, thanks.
As expected the AMO follows this trend very closely,
https://s-media-cache-ak0.pinimg.com/736x/39/0d/9a/390d9a8d7bba5743a785bc9e3283bfce.jpg
with a strong peak in 2010 and falling steadily after that.
2010 is the peak of the AMO for the present positive phase of the oscillation.
The more I look the more I’m convinced that the AMO will probably shift to negative before the end of this decade.
Its already heading downwards. Will we get a second smaller peak . or will it just continue downwards.. Time will tell.
http://climate.mr-int.ch/images/graphs/amo.png
RSS is feeling the effect of the El Nino.
Not the spike of previous El Ninos, and as the El Nino looks like its starting to dissipate, I doubt we will get the spike the alarmista are so wishing for.
After the El Nino.. bring your roller-skates, cos its downhill from there.
And Dmh
there may very well be a deep La Nina going on during the same time.
http://www.weatherbell.com/saturday-summary-november-21-2015
Cold times seem to be coming for the N. Hemisphere during the later half of this decade.
But the alarmists can still take heart because there will probably be some pretty active Tropical storm/hurricane season in the Atlantic and tornadic activity is also likely to pick up in N. America also during that time so they can claim, without shred of evidence, that global warming is causing “extreme weather”.
Satellite data shows Greenland both cooling and warming at the same time.
Reblogged this on Climatism and commented:
Many wonderful ways for Tom and NOAA ‘National Centres for Environmental Information (propaganda)’ to manufacture the “Hottest Month Ever”, by hundredths of a degree.
There are several airports in Greenland that are on the NWS/FAA Mesonet, and those pop up right away on the NWS Weather and Hazards Data Viewer. Was able to spot several with a few clicks, and those would be better/more easily maintained on the ground than the AWS locations. The airports and the ICAO codes: Thule AFB (BGTL), Narsarsuag (BGBW), Kulusak (BGKK), Stroemfjord (BGSF), Jacobshavn (BGJN), Godthaab (BGGH).
There must be a method to retrieve the data; the island cannot be “no data.” The truth is out there.
(Fox and Dana, we may need you again.)
I found those too, but haven’t time to hunt further.
There is actual temperature data for Greenland out there somewhere.. maybe in a few days I’ll have time to go searching properly.
there is good data for Stroemfjord here:
http://www.tutiempo.net/clima/Sdr_Stroemfjord/42310.htm
you can copy and paste to Excel
first three columns is
mean, maximum, minimum
Where there is missing data in the annual data, you must click on the year and go into the individual months.
Where you find a month with the missing daily data, you can take the average for the month of the year before and the year after and fill this result in for the month that was missing. You average the 12 months to get in your annual result.
Once you have the complete graph of all results since 1941, you can do the regressions from the beginning and from various other times.
If you do it right, you could [possibly] end up with a result looking like this:
http://oi60.tinypic.com/2d7ja79.jpg
(the rate of warming in K/annum is the result of all your linear regressions, i.e. the value before the x’s)
must say, something looks fishy,
one must go through all the data,
there is a result of -50 for 1999 that does not make sense….
Steven, it has come to my attention that GISS went public with the October report before Greenland and Brazil had reported their temperatures. The data will be updated when the data arrive. I hope you won’t complain about that, but the temperatures in south Greenland are not dropping.
In case you are illiterate and totally ignorant, as you are..
On October 24th, Greenland summit set a new LOW October record.
And yes, I’m sure GISS will adjust the Greenland and Brazil temps to whatever is necessary to comply with their report.
But let’s pre-empt the LIARS at GISS. Here’s the October temps for Nuuk
http://s19.postimg.org/v3kfap3qr/nuuk_october.jpg
An here I’ve done a quick overlay of those temps over the Nuuk averages and deviations.
http://s19.postimg.org/5akkec5kj/Nuuk_overlay1.jpg
Remember, the upper line is the max, lower line is the min.
You can clearly see that those lines are BELOW the average in each case
REAL DATA makes Martin a PROPGANDA LAIR, yet again.!!
And here’s November in Nuuk so far (with forecast)
http://s19.postimg.org/gobp3a5gz/nuuk_nov.jpg
Andy, all of your Greenland examples show absolute temperature. That doesn’t mean anything in the context of this discussion. Sorry.
I see at least one graph that has average high and low compared to measured high and low. Please explain how that “doesn’t mean anything”.
It says nothing about whether the temperatures in southern Greenland are above normal or below normal. Temperature anomaly is used for that. The NOAA/NASA graphs show temperature anomaly. It can be very cold in Greenland this time of year. It is nearly winter there. But it can be very cold there and still be warmer than normal. That’s why temperature anomaly is used, not absolute temperature. This is all basic climate science.
That’s why temperature anomaly is used, not absolute temperature. This is all basic climate science.
Is it?
https://stevengoddard.wordpress.com/2015/05/10/falling-for-old-jedi-mind-tricks/
And again, the baseline used for comparison is also adjusted, fake, and cherry picked.
gator, you are making yourself look ignorant. This explains temperature anomaly and why it is used instead of absolute temperature: https://www.ncdc.noaa.gov/monitoring-references/faq/anomalies.php
The baseline is updated when warming has increased so much that anomalies no longer drop below the baseline.
Marty I read that nonsense years ago, and then checked it against reality, something that you refuse to do. You blindly and willingly accept everything that the CAGW salesmen tell you.
Now, back to that adjusted, fake, and cherry picked baseline.
The global and hemispheric anomalies are provided with respect to the period 1901-2000, the 20th century average.
The national maps show temperature anomalies relative to the 1981–2010 base period.
Martin, at least one of One of Andy’s graphs shows the October Nuuk average high and low temperatures were below normal (by area below the curve). Below normal is considered an anomaly.
gator, you can’t really cherry-pick a baseline. It doesn’t matter which baseline you use as long as when you compare two graphs, both graphs use the same baseline. The baseline in an anomaly graph just represents where the 0 value is in the data.
All baselines are cherry picked moron. What honest scientists do is try to establish as long a baseline as possible (not just the most convenient 30 years), and work with uncorrupted data, something the CAGW salesmen refuse to do.
And since you failed so misearbly the last time, let’s review some basic climate science again.
1- List all climate forcings, order them from most to least effectual, and then quantify them all.
2- Please provide even one peer reviewed paper that refutes natural variability as the cause of recent, or any, global climate changes.
There is nothing unusual or unprecedented about our climate, or how we got here. For 4,500,000,000 years climates have always changed, naturally. This means there has been a set precedent, and the burden of proof falls on natural climate change deniers like yourself.
I don’t know what your point is, pmc. It may well happen that when the Greenland data is reported, it will reduce the temperature anomaly. It may well be that when the Brazil data is reported, it will increase the anomaly. Apparently, NOAA decided that the result without either of those two contributions should be reported now, which is late as it is. Normally, the data for the entire world are reported shortly after the first of the month and the monthly report is ready long before it was ready this month. Apparently there was some glitch in the reporting system. Do you really believe NOAA reported without Greenland and Brazil to commit fraud as Steven claims? Despite the obvious that the data from Greenland and Brazil will eventually be reported and included? Seriously?
Point is Martin, you said:
“Andy, all of your Greenland examples show absolute temperature. That doesn’t mean anything in the context of this discussion. Sorry.”
Which is not true. Do I believe a political arm of a corrupt government would hide “inconvenient” data and fudge wherever possible? Yes.
Thank you for repeating your questions yet again, gator. Here is the answer to both of them yet again: https://www.ipcc.ch/report/ar5/
You really should read links before posting them, because you posted the wrong link, again.
If you believe the answer is in that link, you will need to attempt to show everyone where it is, because it isn’t there.
Are you really as dumb as you pretend? 😆
That isn’t the point, pmc. You are simply trying to divert the discussion. The point is that NOAA reported without the data for Greenland and Brazil because NOAA didn’t have the data for Greenland and Brazil, and the report was late. Steven’s accusation of fraud is nonsense.
Martin, it’s good to see you admit that your statement was untrue. Accusing me of diverting the discussion? That is ironic and hilarious.
Hello Marty!
Where did you go? 😆
I asked you once again to show me where in you silly IPCC link we can find answers to these…
1- List all climate forcings, order them from most to least effectual, and then quantify them all.
2- Please provide even one peer reviewed paper that refutes natural variability as the cause of recent, or any, global climate changes.
There is nothing unusual or unprecedented about our climate, or how we got here. For 4,500,000,000 years climates have always changed, naturally. This means there has been a set precedent, and the burden of proof falls on natural climate change deniers like yourself.
You wouldn’t be fibbin’, would you Marty? You can admit an honest mistake, can’t you? 😉
It seems that Martin is too INCOMPETENT to follow the basic graphs and realise that October temps at Nuuk will be BELOW AVERAGE.
A mindless, brain-dead, incompetent Goreboy.
REAL DATA truly is not something you can cope with is it !!
We’ll see, but I think there is a strong possibility that the eventual October global figre will be LOWER after the missing figures are updated, as I said earlier, after Paris.
In view of modern communications, and the importance of these figures, I wonder what the problem is with getting all data at the same time. I sometimes wonder if they are still using a runner with a cleft stick to collect the data from some locations.
Quite possible, QV, except that Brazil was left out too. I have no idea what the explanation for the late data is, but in the age of the “internet of things” most of these weather stations are not yet “things.”
You are a liar Mr. Smith and you’ve proven it over and over again.
You are a liar Mr. Smith and you’ve proven it over and over again.
The twit-o-sphere is going stratospheric in their demonization of the Chairman of the House Science Committee and Republicans asking basic questions about non sequitur end-products put out by NOAA. The Cabal of Unconcerned Anti-Science Instigators are parading their support for the criminals too…
https://pbs.twimg.com/media/CUMaP0nWIAAVBtT.jpg:large
The clime syndicate has convinced the sheep the investigators are the criminals.
Their unbelievably-gullible followers are parading that and the anti-reality graphs from NOAA, Met Office and BOM showing a neutered 1998 El Nino and climbing temperatures – all over Al Gore’s InterWeb – displaying their scientific ignorance and their unwavering support of the clime syndicate’s attempts to make the “pause” disappear. Orwell was spot on.
Actually you can not be sure if those are real people. Earlier this year there was an attack on Rush L. Hundreds and hundreds of different ‘people’ When he investigated it turns out it was only about ten people manipulating bots.
So beware of the Astro-Turf campaigns.
I stumbled over THIS. The cartoon is wonderful and the text is to (Rasmussen poll)
http://3jrjps1t0ztwsakr03fp3bhy.wpengine.netdna-cdn.com/wp-content/uploads/2015/11/Syrian-trojan-600-CI.jpg
http://3jrjps1t0ztwsakr03fp3bhy.wpengine.netdna-cdn.com/wp-content/uploads/2015/06/Polar-Bear-Facepalm.jpg
Wouldn’t it be simple to require that when adjusted data is released that the unadjusted datea be released alongside? Then the reasoning for adjustments such as TOBS, site change, funding shortfall etc. could be shown.
It is, wiz. It is.
More pig feces from the Gorebot.
You are a liar Mr. Smith and you’ve proven it over and over again.
The guys from Iceland are TOTALLY DISGUSTED with what GISS do to Reykjavik.
They say it is TOTALLY UNJUSTIFIED.
https://stevengoddard.files.wordpress.com/2012/05/iceland-1.gif?w=640
The real problem is that this same massive change happens with ANY data that GISS get their fraudulent claws into. There are hundred of examples all over the world of blatant trend creating. Here’s just another example.
http://s19.postimg.org/94wuptxdf/quix.jpg
disillusioned says
http://www.woodfortrees.org/graph/esrl-amo/from:1855/plot/rss/from:1855
henry says
Do you see there is a sine wave in that?
Yes. So?
@disillusioned
in case you were wondering about the cycle length, look here
http://virtualacademia.com/pdf/cli267_293.pdf
tables II and III
Thanks. But, why do you think I was wondering about the cycle length? I purposefully posted the longest period possible. Just in case you were wondering, my “hmmm” was because It didn’t post the graphic (only the URL).
ok
then we are both on the same bi-cycle
i trust a blogger guy more than i trust NASA becuase i’m a smart
Appeals to authority are for morons.
Proving that John is totally unable to think for himself..
Well done, John.
ps. I have checked SG’s analysis on a number of times when I have had time to grab the data and do the work….., and while minor errors do occasionally get made, and corrected when noted….. in the long run he is usually substantially correct.
John, I don’t trust anyone who changes the historical past. That’s propaganda.
I suggest you begin by reading a little bit about the blogger guy. You will probably need to pull your head out of your ass first.
https://stevengoddard.wordpress.com/2015/10/01/the-price-of-freedom-is-eternal-vigilance-2/
https://stevengoddard.wordpress.com/who-is-steven-goddard/
Which is more than can be said for climate alarmista and their bletheren…
They hardly ever admit to, let alone correct, their numerous errors.. That is NOT science.
Andy – Bingo! I have never seen a propagandist (or any of their faithful believers) admit to anything substantial. And they always make mountains out of molehills by their critics – while ignoring the Mount Everests that are purposefully built and purveyed by their religious leaders.The hypocrisy of the clime syndicate and their apologist followers is breathtaking.
And John.. You do not type like you are smart.
Rather DUMB, or semi-inebriated, I would say.
What ever possessed you to type such a stupid post ?
Well trying to talk to that ‘thing’ (Is it even human? Or a Bot…) is like talking to … air. So you likely won’t get a coherent reply or response that would do him justice! I on the other hand have been dealing with the likes of him, since this damn climate fraud manipulation was being promoted on youtube and I had to step in and be the voice of reason! Lots of good people just misled and buying into the massive propaganda campaign… And lots of these types trying to mislead them further, and try to prevent them from discovering, well information such as what is available on this site!
Discovered this site while pointing out the B.S. to other real individuals, we call it TTFD (thumbs the fuk down) + TRUTH BOMB 😀 [on pure propaganda / non science videos shamelessly promoting this and other crap]
So thank you Steven for creating this nice resource and keeping track for us! 😀