
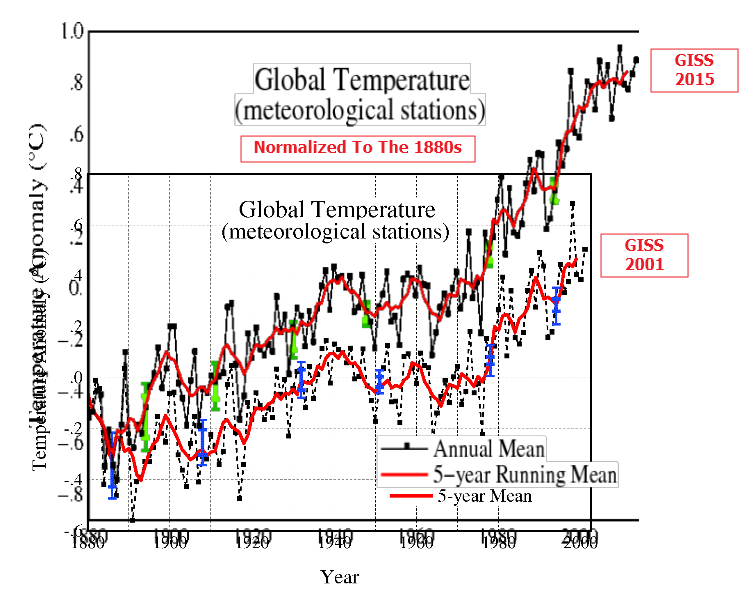
NASA has massively altered their global temperature data over the past 15 years, to double global warming.
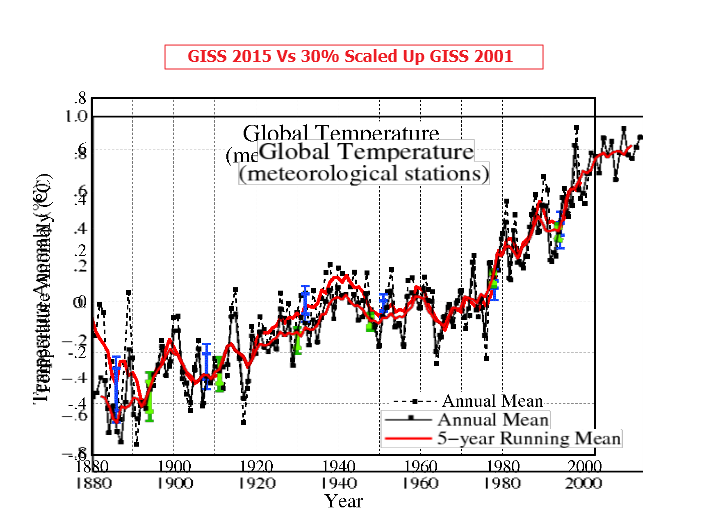
The next graph shows the two at the same scale, normalized to the 1880’s. This graph is the best way to view the change since 2001 in claimed global warming.
The data tampering algorithm they are using is largely just a linear scaling. If the 2001 version is scaled up linearly by 30% along the Y-axis, we get a fairly good match from 1890-2000.
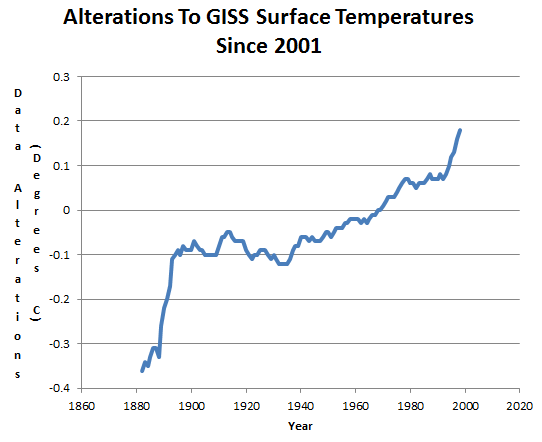
The next graph shows that the data has been tampered with by almost 0.6C over the past 15 years.
After altering the data by 0.6C, the criminals at GISS claimed a global temperature record by 0.01C

What are the best studies showing that data has been tampered with? Peer-reviewed references please.
The incredible thing is that the climate science community has allowed this obvious fraud to go on for decades right under their noses.
If you are too stupid to follow links, don’t comment. There is nothing to prevent you from analyzing this very simple data yourself.
There is nothing to prevent you from analyzing this very simple data yourself.
All you need beyond finding the data is a modest ability with an Excel spreadsheet.
So how come no climate skeptic has not studied the issue rigorously enough to publish the results? Are they afraid that there is no fraud after all?
They are published.. all over the web.
That gives them much wider peer-review than any journal will ever get.
Where exactly did you hear about all these unjustified adjustments.?
“So how come no climate skeptic has not studied the issue rigorously enough to publish the results?”
How come you’re too stupid to use Google?
CFGJD,
In case you’re new to this issue, you may want to familiarize yourself with “climate science” and the practices of “climate scientists.”
No dissenting views are allowed in the church of climatology (97% and all that).
Data: Only accepted if appropriately homogenized to fit the 97% belief system.
Peer review: a process by which pals in the climate clergy certify each other’s views to be congruent with the 97%. Non-pals are systematically destroyed, denigrated, ignored.
Congressional subpeona for public records related to government employees’ activities related to climate “research”: a dastardly ploy by un-believers to nit-pick collegial discussions for statements that can te twisted to discredit the 97%.
Peer review of data homogenization; Only pals allowed to see details (see Subpeona).
Hope that helps in your search for dissenting “pal reviewed” articles on this issue.
http://www.techtimes.com/articles/101035/20151030/noaa-scientists-refuse-to-comply-with-house-science-committee-subpoena.htm
So in other words there are no verified studies showing there’s something wrong in the handling of temperature data? I suggest you go and produce some evidence before making wild-ass claims and accusations.
The evidence is shown right here. If you are too stupid to understand it and check the data for yourself, I will block you from posting here.
cfgjd-
Since you speak for scientific truth, you should have no problem linking us to a peer reviewed study supporting the adjustments that have been made to the data. The burden of proof is on those making the changes, not on those defending the measurements. Until the full chain of reasoning behind the adjustments is made public, they are most accurately termed fraud. Once we can see their work, we can debate it on it’s merits. We may even find that it’s all in order, and join you in the fight. But to this point, no one on this site has been able to find the work in question, and secrecy breeds distrust. If you know where to find it, you’d be doing a great service to the advancement of climate science by pointing us in the right direction.
CFG,
“So in other words there are no verified studies showing there’s something wrong in the handling of temperature data? I suggest you go and produce some evidence before making wild-ass claims and accusations.”
Sorry for your reading comprehension issues.
Your “other words” are nothing close to what I said, nor to the real situation.
The fact that the Climate Clique enforces discipline, much like the Mafia’s omerta, is NOT evidence of the correctness of their “science.” In fact, their refusal to allow dissent is actually evidence of their bad intentions–see frauds and conspiracies.
So you want to postulate but insist on peer review from everybody else? Do you remember this gem where you conflate local weather with climate and then site no reference at all?
“Since Europe has been unseasonably warm for months I postulate that the jet-stream is acting up again…might explain what is going on in Greenland.”
cfgjd, I now claim that the inner core of Jupiter is made of gorgonzola. Unless you can produce a verified study refuting my amazing cheese-based discovery, I suggest that you not make any wild claims that it is not true.
In the minds of many CAGW enthusiasts, that is how they think science works.
As a start cfgjd, I can send to you original data from any location in the U.S. including Alaska and Hawaii. (choose a postal area and I will send to you, or anyone else the temperature, and or precipitation and other parameters from the closest geological stations in the area. The US is only a small amount of the surface area of the earth of the US but it has some of the best long term measurements
Then again Michael Mann bases his infamous hockey stick graph only on bristle cone pines in Colorado and Northern California. Other proxies in the dubious study, using a method called principal components, did not show anything like a hockey stick graph.
A simple question cfgjd, will sending you the temperature record be acceptable?
Or you can go back to a March posting by Roy Spencer in which he states that the temperature record changes even when it doesn’t change. In 2014 it showed the long term temp change in the corn belt to be 0.2 deg C. In 2015, NASA showed it to be 0.6 deg C. These are simply taken from NASA’s own records. You can do this for yourself!!!! Both graphs are shown and as usual the change is increased by lowering the old records and raising the new.
Here in southern MN in most of the 30’s, the average temp was 90 deg F for long summer periods and the high over 100. Of over half of the area of the 10,000+ lakes were dry, some farmed, but mostly pastured, due to the alkalinity In the last decade the highs were only slightly over 90.
I am putting myself on the line here and by doing so I will be changing my email in a month if I get overwhelmed. My email address is [email protected]
and if you send a request to me, please show respect and use your name, I will use mine.
I will be leaving shortly until Christmas, but if I say I will send it, then I will.
“A simple question cfgjd, will sending you the temperature record be acceptable?”
Perhaps I am too cynical, but I suspect that cfgjd would NOT find that acceptable. Based on many conversations with other CAGW proponents, I think that what they really want is this: They want some government funded person who supports the same opinion they do, to claim that yes, they are correct. The actual temperature record has nothing to do with it.
Over time, I have verified many of SG’s reports.
And yes, I am well qualified to check them.
Peer-review is actually a journalistic / publication issue….. it is NOT part of the scientific method.
One of the most blatant of unjustified adjustments is Reykjavik.
The 1940’s peak squashed completely, and the guys in Iceland who look after the records REFUSE to follow the UNJUSTIFIED GISS adjustment. They say it is totally WRONG
The whole removal of the 1940’s peak, from MANY records around the world is absolute scientific FRAUD.
When the hockey stick was prepared for the third IPCC report, the general checks and scientific processes went out the window. In presenting the report the infamous graph was in the background.
Of course without global warming the IPCC would cease to exist and one thing we have learned about human nature is that any person or entity wants to survive.
It wasn’t until the release of the 2009 emails that many people began questioning the validity of it and just about all of climate science.
So Cf and the rest, (I would prefer a name) if you really want to get in a deep discussion about the models, lets have had it.
The general physics is right, the assumptions are many, the uncertainties keep growing.
In the end, it is kind of like an engineer trying to build a model from the atoms on up.
Do you understand things like black body radiation, dry adiabatic rate, quantum mechanics, and a myriad of other things that really is best for another blog.
If you do great. If not, the information given here is correct and very useful, and yes several of us validate it. A scientist trusts nobody, including him or herself. That is why there should be the availability of data so it can be checked. It is also why much of the climate community should be hung out to dry. especially Mann et al.
What I have the most problem with in terms of the temperature record is how the record gets adjusted (homogenized) and then, well OK I disagree with much of the process but I will maybe accept the Karl Krap call it K squared.
But then damn it, the adjusted temps get adjusted again and then again and again and….
and again and the adjustment continues in one direction In effect they keep saying they goofed up before but now they are correct, and then whoops we goofed up again (using the g instead of the f word and then well, looks like we did it again.
AndyG55 says: The whole removal of the 1940’s peak, from MANY records around the world is absolute scientific FRAUD.
Right! Those are the real “Climate Den*ers” – the ones who d*ny the existence of the Dust Bowl, the Medieval Warm Period, the Little Ice Age, and even that chilly spell in the 1960s and 1970s that many of us remember so well (and triggered ice age forecasts).
BTW, my PhD Thesis was about that chilly spell, and I’d hate to think my thesis was about a fantasy.
Richard, Aren’t most PhD’s about a fantasy 😉 🙂
CFG, also note… These are ONLY changes since 2001…
Read Hansen, et. al 1981…
If we could go back far, the changes would be even worse.
The source for those two graphs is given, and it is NASA. The latter shows 0.3 degrees more warming. 50% larger anomaly. With surface warming faster than the hot spot warming? No, you can’t change your story all over again and continue with claims of certainty.
Like your Antarctic ice sheet. Zwally found the sign wrong, its growing after all, because the boneheads thought rising ice sheet surface level means melting ice. Doh.
The official (adjusted) temperature records can be described thus: “The science was settled when we first reported it, and now that we have changed our story, it is still settled!”
One of the more blatant markers of fraud is the fact (as Tony points out) that a simple scaling of 30% makes such a nice match. Can anyone think of a plausible reason why all the thermometers on earth would have experienced a century long progressive linear malfunction — and then explain why that malfunction was not discovered until after 2001? If gfjd cannot see that as clear indication of fraud, then perhaps he can tell us the reason for the “adjustments” — and if he cannot explain the reason, then perhaps he is just another apocalyptic troll.
I am getting disgusted with the continued anti-science rhetoric of the warmist crowd. It becomes more difficult to treat them as if they were rational.
Reblogged this on WeatherAction News.
It looks like the “adjustments” to the time-series have not been rigorously studied? Why is this? The end-result is that there are just a few opinion-pieces about the issue but nobody has bothered to do the work and properly study the issue. Again, the skeptics are failing to produce and publish studies….seems to be a pattern.
If you can link us to the work which justifies both the need for, and the magnitude of, the adjustments, we’d be happy to rigorously study it. The understanding of just about everyone on this site is that the afore mentioned work is not publicly available. If we’re in error, then please point us in the right direction. I would very much like to change this to a discussion of science, rather than a test of faith.
The Data is the Data – leave it alone.
I’ve been trying to figure out the proper term for the product of data adjustments. Data is the measurements. Once it’s been adjusted, it’s something else. I just can’t come up with an appropriate word. This is a grammatical question, completely independent of the validity of the adjustments. Even if everything is proper, the data is still the original measurements. Even NASA and GISS refer to the adjusted product as value added data, in recognition of that fact. Does anyone know the word I’m looking for? Gail, perhaps?
Shit
Sorry, I couldn’t resist.
I think what you are looking for is adjusted series. Then you know to go looking for the type and reason for the adjustments.
“I’ve been trying to figure out the proper term for the product of data adjustments.”
The proper term is “unsupported assertion.” Just in case there are some CAGW enthusiasts reading, note that “unsupported assertion” is not a synonym of “science.”
wizzum says: Sh*t
You must be referring to “data” from Scotland. Outside of Scotland it’s referred to as CRAP
https://www.youtube.com/watch?v=seN7AKSwMFU
Which, of course, refers to the Climate Research and Analysis Program (the overseers of NCDC, GISS, and CRU).
Actually, in Scotland it is correctly referred to as Shite.
https://www.youtube.com/watch?v=G1tJJO_pVvQ
But in the Queen’s English, data is defined as
1. factual information (as measurements or statistics) …
http://www.merriam-webster.com/dictionary/data
Which would imply direct measurements. But the dictionary goes on to say
2. information output by a sensing device … and must be processed to be meaningful
and
3. information in numerical form that can be digitally transmitted or processed
Which means it can be processed and still be data, even if the result says more about the processing than it does of the initial observations.
Sort of like Velveeta® “processed cheese product”. Is it cheese, or processed product?
Maybe we can call the stuff put out by NCDC, CRU, and GISS a “processed information product”, or, simply, Velveeta®.
Once data has been adjusted, it is no longer data, it is an artifact of analysis.
“I’ve been trying to figure out the proper term for the product of data adjustments.”
===============================================================
“FUBAR” of course, because it is.
The raw data is almost impossible to get and produce on a global level with the loss of data (whoops) original addition of and then later dropping of thousands of station, changing of instruments, literally thousands of poorly documented adjustments, many of which are done without fanfare through computer algorithm with zero attempt to explain, and finally very questionable UHI adjustments.
“It looks like the “adjustments” to the time-series have not been rigorously studied?”
Because these are a closely held secret. See the links to Congressional requests, and subpeonas, for justification and discussions between the government “scientists” who plan and implement the “homogenization” of the real data.
They refuse to provide access to their justifications, and they refuse to discuss their justifications for altering decades-old data. They refuse to cooperate with those who pay their salaries and expenses.
In the language of fraud investigation, the “scientists'” actions in dealing with questions about the data-tampering, are “highly suspicious” and “alarming.”
When “data adjustments” are made to bank books, or corporate accounts, the “adjusters” are always able to provide long and tortured excuses. That is, until they face real auditors. Then their whole scam collapses. That is why fraudsters always attack real auditors, and vilify those who ask tough questions about their fraudulent data. Because they are hiding something, they block access to their books as long as possible, hoping the questioners will go away.
Again, the reason there is no “peer-reviewed” analysis of the “homogenization” of temperature data is because the climate clique refuse to allow it.
Hope that clarifies the situation for you. Don’t hold your breath for “peer-reviewed” publication until indictments, and probably convictions.
“When “data adjustments” are made to bank books, or corporate accounts, the “adjusters” are always able to provide long and tortured excuses. That is, until they face real auditors. Then their whole scam collapses.”
In the aftermath of the Enron scandal a whole new set of laws was written, the Sarbanes-Oxley Act ( https://en.wikipedia.org/wiki/Sarbanes%E2%80%93Oxley_Act ) was written to provide a mechanism to fight just such “creative accounting” practices.
I was working as a programmer for an energy company when Sarbanes-Oxley was put into place and it made a big difference in the way we could go in and make “quick fixes” to correct data errors (these were real corrections, not accounting tricks). Prior to Sarbanes-Oxley, I could have gone in and ran update queries on the data to get myself issued checks for millions of dollars in oil royalties. Of course I would have gotten caught and ended up in jail (see Richard Pryor in Superman III), but the point is that I had previously had that power.
After Sarbanes-Oxley they put a system of procedures and accountability (including criminal penalties) in place that exercised a measure of control on data manipulation.
I see nothing of the sort in the AGW temperature adjustments.
In most fields there’s a natural system in place that provides accountability. The bridge collapses, your form doesn’t work, the crops fail because vernalization doesn’t work, etc.
The AGW crowd has produced prediction upon failed prediction, baroque computer simulations powered by secret code written by grad students. The predictions have failed by vastly overestimated warming.
Hence the need to provide “adjustments” to both old and new data to prove your predictions are indeed coming to pass. With no accountability as to the need for and nature of the adjustments, you can wave a wand and make your warming predictions come true by both cooling the past and warming the present.
Hey Dave, yes, I think you have nailed it. The only problem is that people like Tony Heller insist on checking the historical record to see whether it matches the “new, improved, altered” history being newly created. I have warmist friends who constantly tell me of some current weather event — drought here, flood there — but when I point out that those same regions had the same weather in the past, they seem strangely unable to accept the fact that today is not unprecedented.
But today IS unprecedented. December 7th, AD 2015, has never happened before.
Todays weather, on the other hand, is pretty unremarkable.
Hey Ted! “But today IS unprecedented.”
Maybe unprecedented to you and me — but the “climate scientists” know all about it well before it happens. After all, they modeled it!
Speaking of climate scientists… Have they ever given actual predictions? You know, something like, “No later than (insert date here) this (insert event here) will happen.” I know that they present “scenarios” — “this is one possible way that the future may turn out.” And they present possibilities — “this MAY (or may not) happen”. And they tell us unverifiable things like “We will see increased drought (somewhere) and increased flood (somewhere.)” But have they made any actual predictions?
Gees.. glad that you have heard about the masses of adjustments that have been made..
Where did you hear about it from ?
Which journal have you ever read. ?
CFG – Do try to keep up. Just because you ignore it, doesn’t mean it did not happen.
What they say.
Climate Etc. – Understanding adjustments to temperature data
by Zeke Hausfather All of these changes introduce (non-random) systemic biases into the network. For example, MMTS sensors tend to read maximum daily temperatures about 0.5 C colder than LiG thermometers at the same location.
http://judithcurry.com/2014/07/07/understanding-adjustments-to-temperature-data/
What He measured
Interviewed was meteorologist Klaus Hager. He was active in meteorology for 44 years and now has been a lecturer at the University of Augsburg almost 10 years. He is considered an expert in weather instrumentation and measurement.
One reason for the perceived warming, Hager says, is traced back to a change in measurement instrumentation. He says glass thermometers were was replaced by much more sensitive electronic instruments in 1995. Hager tells the SZ ” For eight years I conducted parallel measurements at Lechfeld. The result was that compared to the glass thermometers, the electronic thermometers showed on average a temperature that was 0.9°C warmer. Thus we are comparing – even though we are measuring the temperature here – apples and oranges. No one is told that.” Hager confirms to the AZ that the higher temperatures are indeed an artifact of the new instruments.
http://notrickszone.com/2015/01/12/university-of-augsburg-44-year-veteran-meteorologist-calls-climate-protection-ridiculous-a-deception/
Adjustment + 0.5 °C less reality -0.9°C = 1.4 °C too high. Published and everything.
How many times have 1880 data been revised? Is there a list of revisions we can go to?
Yo cfgjd…
The turtured data released by CRU, GISS, and NCDC aren’t peer reviewed, either. Karl, Gavin, and Phil get in front of microphones to release that data, usually a month before the year is over. Somehow they already know the year will be the hottest ever. So “peer review” is irrelevant here, since it has been redefined as a gatekeeping mechanism to keep out inconvenient facts.
“I can’t see either of these papers being in the next IPCC report. Kevin and I will keep
them out somehow – even if we have to redefine what the peer-review literature is”
Phil Jones (CRU Temp) to Mike Mann (Hockey Stick) November 24, 2009.
https://publicintelligence.net/climatic-research-unit-emails-even-if-we-have-to-redefine-what-the-peer-review-literature-is/
So there’s a reference that bypasses the Peer Review (aka PR) gatekeepers.
Hey Richard! So glad you included that quote, “I can’t see either of these papers being in the next IPCC report. Kevin and I will keep them out somehow – even if we have to redefine what the peer-review literature is”
It is mind boggling that any person with even a pretense of interest in real science could read that quote and not immediately see that it is the exact opposite of science. It is anti-science.
That “peer review” line really sums up the perversion of the scientific process by the climate scammers. It’s more subtly stated on the IPCC flow chart
http://www.eusem.com/images/CE/IPCC01.jpg
Which has Government – Political – reviews & approval at the start and end of the entire report process, with the actual science buried down at the bottom. The IPCC diagram reminds me of this diagram of a similar process
http://www.averillparkseptic.com/mediac/400_0/media/Septic$20Tank.jpg
Note that Septic Tanks are also known as Settling Tanks, as in Settled Science. That’s what sinks to the bottom.
Nice post, Richard 🙂
+1! 🙂
IPCC reports are like Wikipedia in the sense that it does not contain “original research” but only a review of existing research.
So, if cfgjd want a peer-reviewed paper that trashes the NCDC et al. adjustments, he can place this one in his pie-hole:
Re-evaluating the role of solar variability on Northern Hemisphere temperature
trends since the 19th century
Willie Soon, Ronan Connolly, Michael Connolly
http://www.sciencedirect.com/science/article/pii/S0012825215300349
From the abstract:
“Although attempts have been made to account for non-climatic biases in previous estimates of surface air temperature trends, recent research by two of the authors has shown that current estimates are likely still affected by non-climatic biases, particularly urbanization bias.”
From the full text:
“It is true that the Menne & Williams, 2009 algorithm has performed very well at identifying (and correcting) artificially introduced biases in simulated data (Venema et al., 2012; Williams et al., 2012). However, two of us (RC & MC) have shown that the algorithm performs poorly
when a substantial fraction of neighbouring stations are similarly affected by comparable non-climatic biases (Connolly & Connolly, 2014c; 2014d). In such cases, the algorithm can often lead to a blending of the non-climatic biases between stations, rather than actually removing the
biases.
In particular, when a substantial fraction of neighbouring stations have all been affected by urbanization bias (as is the case for many urban areas), the Menne & Williams algorithm can lead to “urban blending”. That is, the urbanization bias of heavily urbanized stations is only
reduced to match the average urbanization bias of the neighbours, and if there are only a few rural neighbours, they may have “urbanization” bias artificially introduced into their records (Connolly & Connolly, 2014c). Similarly, if the majority of stations in an area are affected by
similar biases, as seems to be the case for siting biases in the U.S., the algorithm can actually introduce biases into the records of non-biased stations (Connolly & Connolly, 2014d).”
Soon et al., in a polite and understated way, say the adjusted temperatures are CR*P.
As for the NCDC data adjusters,
“Our algorithm is working as designed”
http://wattsupwiththat.com/2014/07/01/ncdc-our-algorithm-is-working-as-designed/
Which means it’s intentional, so Steven’s characterization of an intentional error as fraud is correct.
UHI adjustments would go the other way.
The NCDC urban adjustment goes counter to common sense. Their urban adjustment is for the step changes when a station moves from, say, downtown to an airport. Initially that results in lower temperatures, so they add a degree or so to the airport temperatures to match the older city temperatures. But they do not adjust for the urban growth that later surrounds the airports.
Examples would be Chicago O’Hare and Philadelphia Intl airports, which, when were out in the boonies and noted for cooler temperatures (especially at night) when the official thermometers moved there (in 1959 and 1940, respectively). But now both airports have maybe a square mile of black asphalt and are surrounded by industrial parks, and are as warm as or warmer than the city centers. But that’s NOT adjusted for.
It’s yet another way to included only those adjustments that ratchet up the temperature trend.
Meanwhile, Hansen & GISS used to apply a UHI adjustment based on population, but it was minimal – a fraction of a degree for a million inhabitants (perhaps SG has the details of this in his massive files). I think Gavin got rid of that, explaining some of the introduced warming (again, maybe SG can verify this).
Over at BEST the adjustments come from an algorithm that finds step changes, some really due to a station change and some just random. But UHI, being gradual, isn’t found by these step changes, so BEST effectively doesn’t adjust for UHI, either.
As for CRU, I have no idea what Phil Jones does except redefine the peer review process, which appears to mean getting Mike and Kevin to sign off on whatever he does.
Anyone remember this?
http://climateaudit.org/2005/10/15/we-have-25-years-invested-in-this-work/