
Ohio had an incredible heatwave during September, 1897. It took less two minutes to generate all of these graphs with my released software.
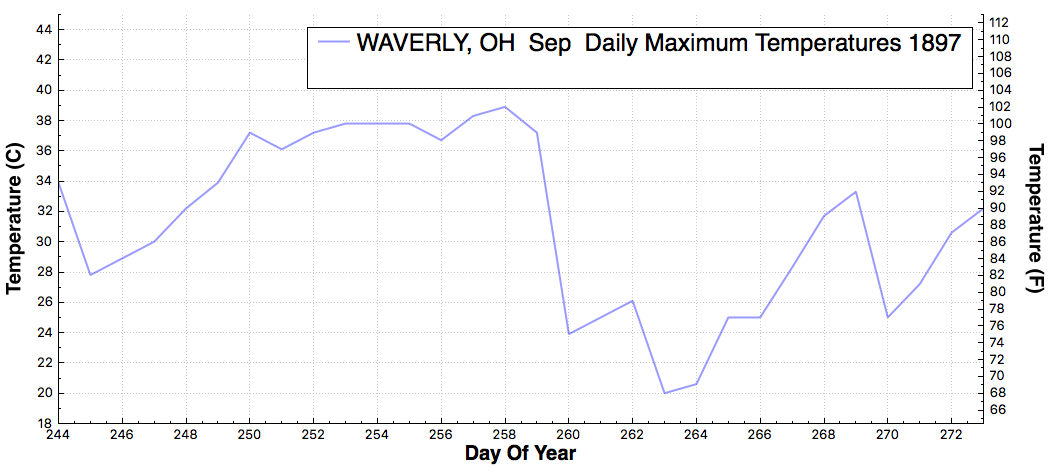
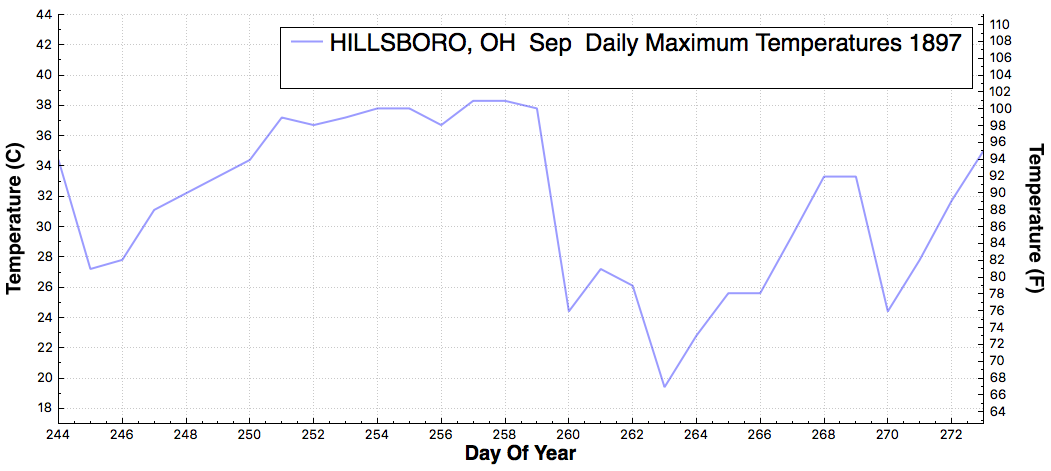
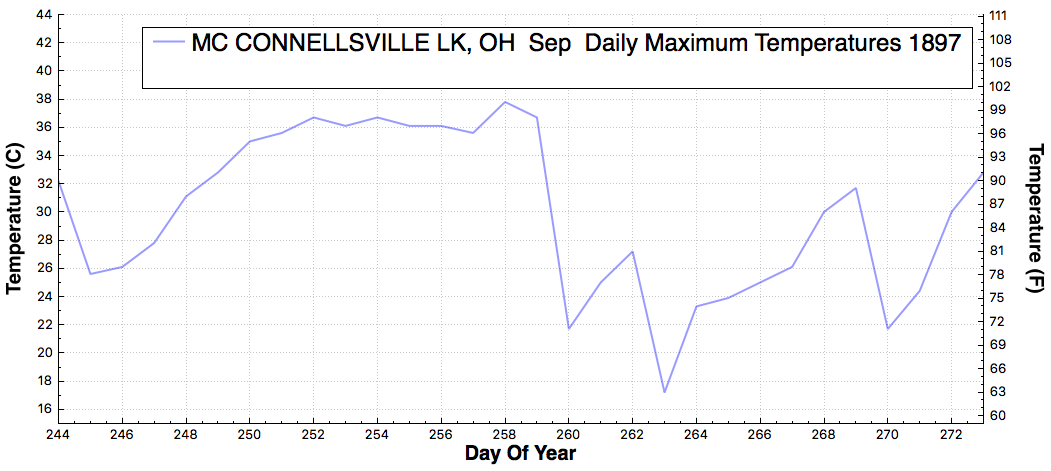
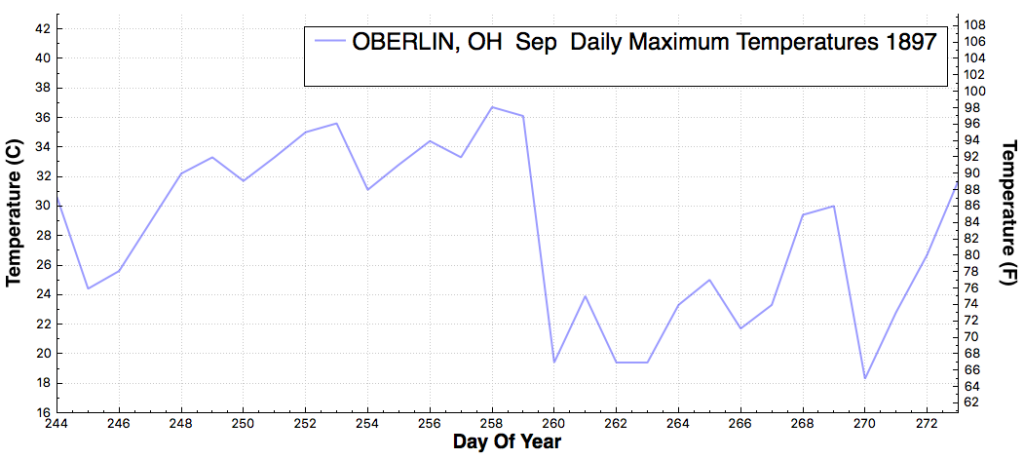
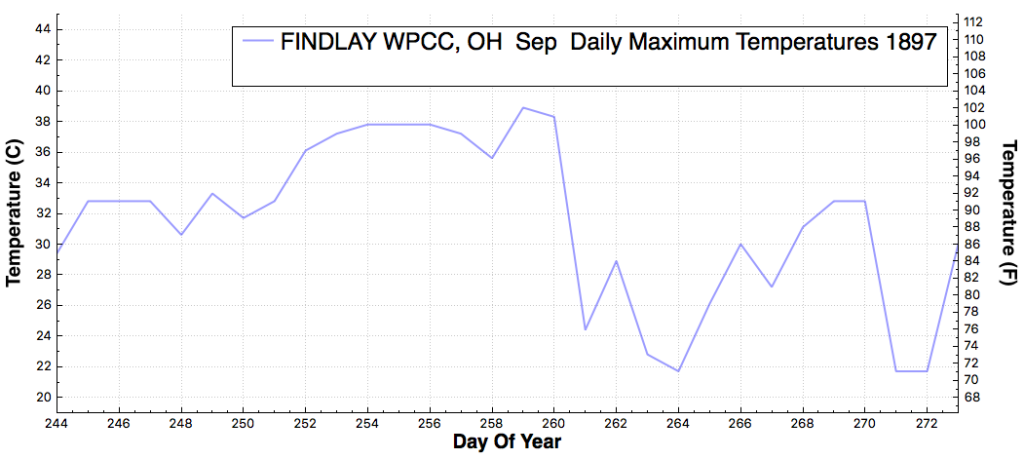
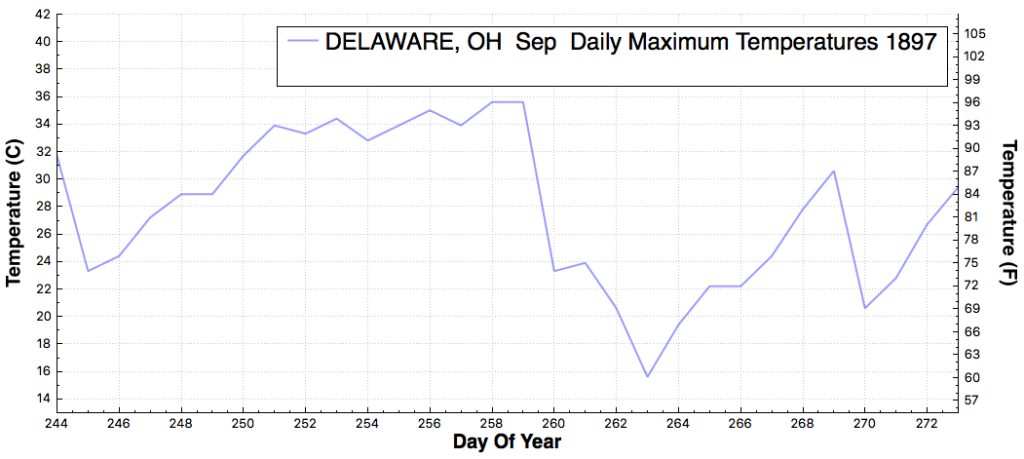
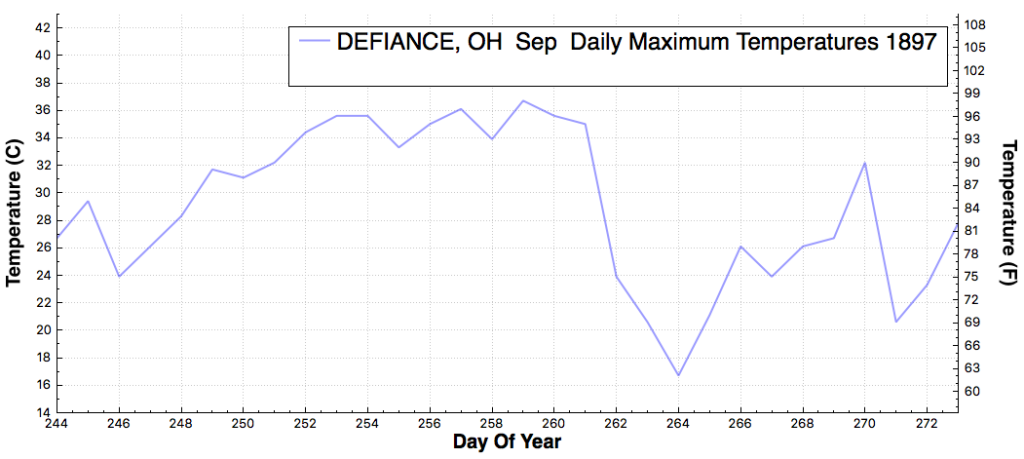
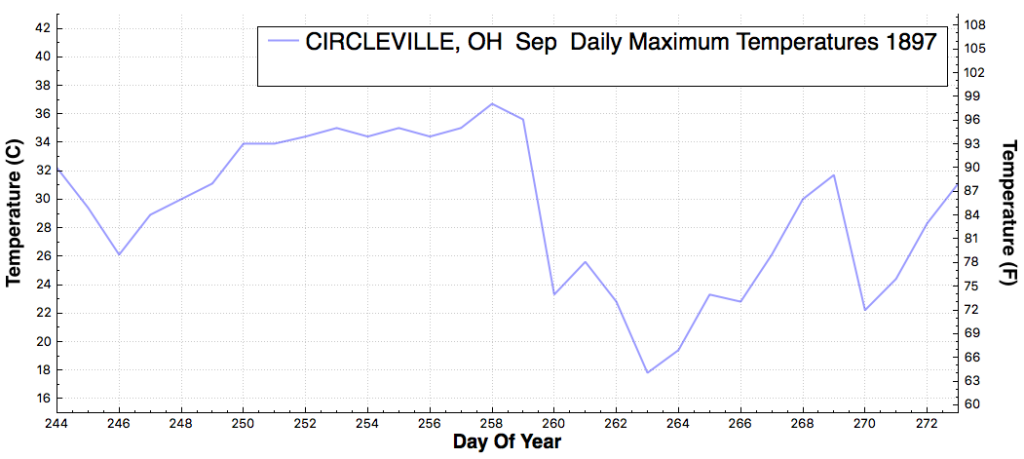
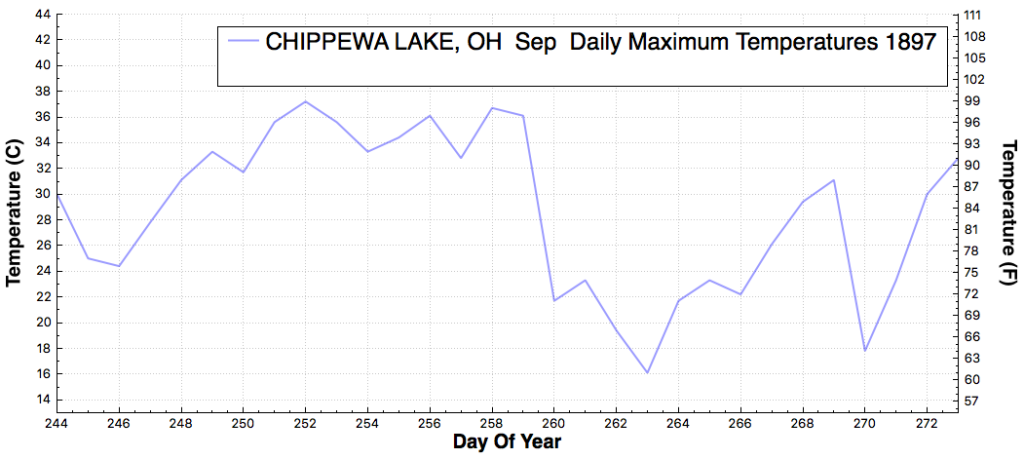
Ohio had an incredible heatwave during September, 1897. It took less two minutes to generate all of these graphs with my released software.

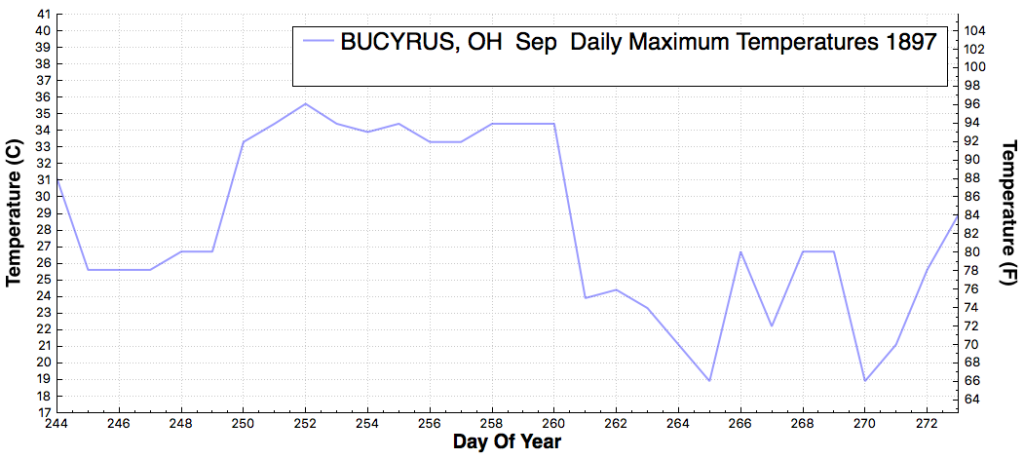
It took less than a minute to confirm your plots, and check Tiffin, OH which also shows the heat.
SOFTWARE NO!
REALWARE!
You Go Bro!
January now in for USCRN and full UAH.
After a somewhat strong positive anomaly in December, all 5 data sets for the USA show essentially zero anomaly for January. (ClimDiv not graphed because it is data matched to USCRN)
http://s19.postimg.org/8lgilst2r/USA_January.png
Curious that USCRN is showing greater amplitude swings, up ad down, during the Niño’s.?
Bucyrus caught my eye. The name was on huge steam shovels digging the Panama Canal, but out of Milwaukee, not Ohio: https://www.youtube.com/watch?v=2S3w1h_Pd_8
People were much shorter in 1897 and looking up at the thermometers at 2 meters made it look much hotter than it was. Now if I can pass that information on to NOAA, they can easily justify another degree or two adjustment!
OT sorry.
There is an interesting new NASA article here: .. http://www.nasa.gov/feature/jpl/study-long-term-global-warming-needs-external-drivers … talking about the Planck Response among other things. The researchers say that: “.. the findings may finally help put the chill on skeptics’ belief that long-term global warming occurs in an unpredictable manner, independently of external drivers such as human impacts.”
Hi Tony,
The Australian BOM have updated their ENSO charts if you’re interested back to 1876.
Source data is from BOM.
What is interesting to me is I can see no trend in frequency or severity of ENSO.
This is despite the doom & gloom that numpty Tim Flannery has been spruiking over the past 12 months. So glad the Climate Commission was shut down by PM Tony Abbott.
Now PM Malcolm Turnbull is making 350 CSIRO “climate scientists” redundant.
Also there seems to be no La Nina effect on the 1930’s US heatwaves. Very clear El Nino effect on Australia for the Federation drought (1897-1902) and the 1983 Drought which Alarmists conveniently forget.
http://www.bom.gov.au/climate/current/soi2.shtml