
In 1999, NASA’s James Hansen showed about 0.4C global warming from 1880 through the late 1990’s, for rural, small town and urban areas.
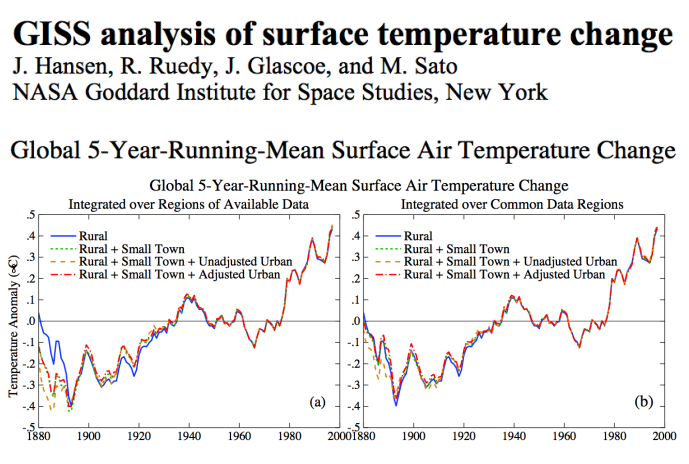
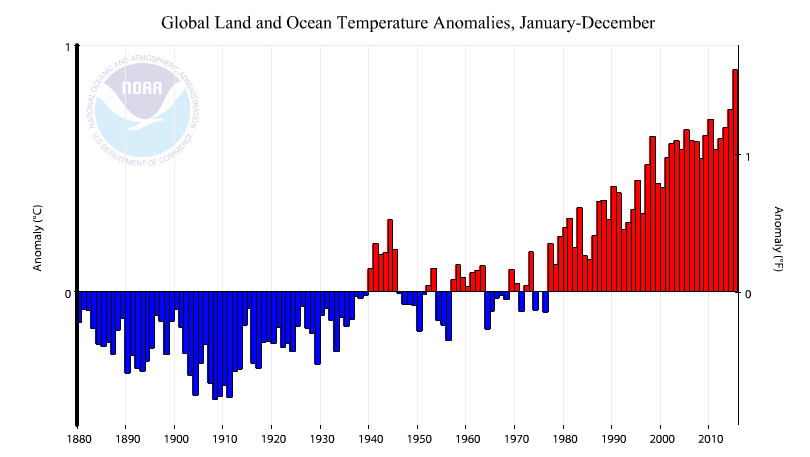
NASA now shows three times that much global warming (1.2C) from 1880 through the late 1990’s.
It is bad enough that NASA tripled 1880-1998 global warming by altering the data, but when we consider that NOAA’s Tom Karl said the planet cooled from 1921 to 1979, it becomes painfully obvious that we are dealing with the biggest scam in science history.

The scam began after nations and national Academies of Sciences were united on24 OCT 1945 to hide the source of energy in atomic bombs and stars from the public and thus SAVE THE WORLD FROM NUCLEAR ANNIHILATION !
My attempt to peacefully end seventy years of deception was delayed when someone else “withdrew” the paper submitted to Nature on “Solar energy” on 15 March 2016.
https://dl.dropboxusercontent.com/u/10640850/Solar_Energy2.pdf
The London GeoEthics Conference that Swedish Professor Nils-Axel Mörner organized for 8-9 September 2016:
https://geoethic.com/london-conference-2016/
will hopefully bring a peaceful and final conclusion to this issue by helping society re-establish contact with reality.
That has nothing to do with this post
To me it seems clear that there must be some combination of lying and/or incompetence, previously and/or now. If there is any other explanation for this discrepancy, I am certainly eager to learn of it. How else would the current temperature record be so at odds with the previous temperature record, from the SAME organization?
So this tampering of the temperature-record caused the widespread melting of mountain glaciers, mass-loss from ice sheets, loss of Arctic sea ice and bid reductions of Northern Hemisphere snow cover? Wow.
Glaciers have been mostly melting for the previous 14,000 (or so) years. I doubt the recent temperature record conjuring would have a significant effect on glacial melt.
Are you actually as stupid as you pretend to be?
http://trove.nla.gov.au/newspaper/article/23150667
Idiot, we have been through this before.
If I take an ice cube out of my freezer and place it on my kitchen counter it will continue to melt, even if I turn the thermostat down a few degrees.
At this point, we know that you are a liar, an idiot, or both.
cfool is basically unable to recognise anything that isn’t drip fed to him by the climate blob.
What I can’t figure out about these warmists is how the claim to know so much and yet don’t seem to understand that they live on a dynamic ever changing planet despite the massive amount of evidence that demonstrates that. Nothing is forever on this earth. And the whole scam is based on the idea that natural variability is virtually non existent.
That is why a healthy background in geology is essential for understanding climate change, and this temporary rock we call home. One of the first things you learn as a geology student is that there are no permanent features on, or in, our planet.
Alarmists remind me of creationists. They cast aside any science that disagrees with their ideology.
Retreating since when
Oh.. you mean since 1979 as part of the NATURAL cycle
https://wattsupwiththat.files.wordpress.com/2015/09/clip_image004.png
http://i51.tinypic.com/24yptu0.jpg
Greenland was not losing mass before the mid 1990’s or so. WAIS also started losing mass recently together with the Antarctic Peninsula. If warming continues WAIS will inevitably collapse causing a few meters of extra sea level rise…
You have no idea what you are talking about
http://trove.nla.gov.au/newspaper/article/40934044
cdqgfj says: Greenland was not losing mass before the mid 1990’s or so. WAIS also started losing mass recently together with the Antarctic Peninsula. If warming continues WAIS will inevitably collapse causing a few meters of extra sea level rise…
——————————————————————————————————-
Yea, Leif and his Noresmen walked to Greenland on ice and built the stone great houses and even a Cathedral on ice. And grew grains and raised livestock for 100s of years on ice.
https://wattsupwiththat.com/2016/01/19/debunking-the-vikings-werent-victims-of-climate-myth/
And the Western Ice shelf is unstable because of geothermal activity not climate. But even it has been shown to have actually gained some mass in a two recent studies.
“Greenland was not losing mass before the mid 1990’s or so.” = 100% BS.
http://science.nbcnews.com/_news/2013/03/21/17403302-pre-viking-tunic-found-on-glacier-as-warming-trend-aids-archaeology?lite
Uh, I should have posted a Greenland relevant link:
“What’s really interesting about this is that on land, the atmosphere was warmest between 9,000 and 5,000 years ago, maybe as late as 4,000 years ago. The oceans, on the other hand, were warmest between 5-3,000 years ago,”
http://phys.org/news/2013-11-greenland-shrunken-ice-sheet-weve.html
Right, Greenland was the only landmass in the northern hemisphere that did not lose ice when the interglacial started. Reference please? 😆
It is hard to lose ice mass from the interior of Greenland and Antarctica when it never gets above freezing.
Reblogged this on Climate Collections.
Reblogged this on TheFlippinTruth.
Now our government under the Dear Leader wants to prosecute scientists and I guess everyone else that does not believe in climate change/global warming. NASA and Dear Leader want to jail people for making movies to inform the public of the truth. There is a name for that, it’s called a Dictatorship.
All this data altering, shouldn’t they go to jail? We know which way quite a lot of these people lean. I’m sure not getting any bang for my tax bucks, mandatorily taken from me year after year to support these FRAUDS. Maybe it is time for NASA and others of that ilk to be tossed into the dustbin of history.
I hope that this madness will end or at least begin to subside, and that sanity will return in 279 days, 03 hours, 49 minutes and 26 seconds.
Your graph of Giss data is for meteorological stations. That is land based data. Here is the NASA Gistemp global data land and ocean data with yearly and 5 year smoothing to 2000.
http://woodfortrees.org/plot/gistemp/mean:12/to:2000/plot/gistemp/mean:60/to:2000
It is essentially the same as the adjusted global data in the first graphs at the top.