
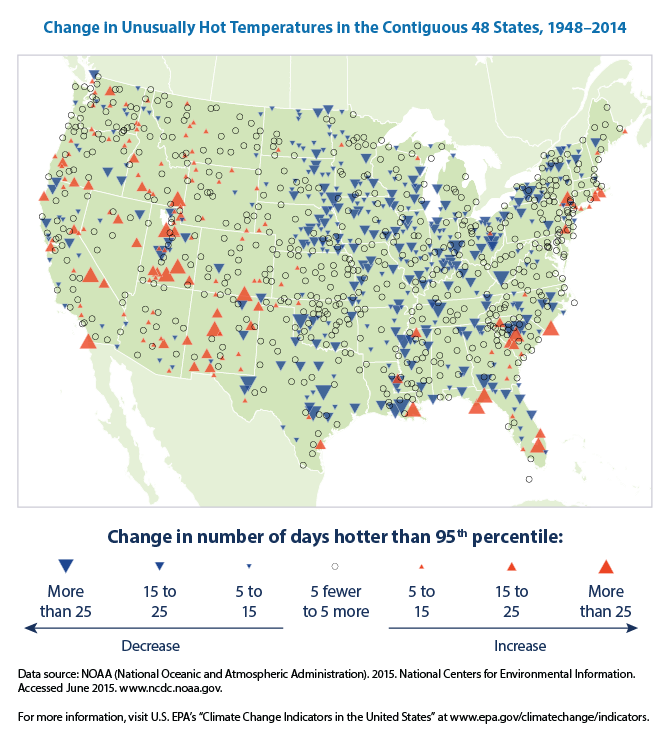
Note in the map below that South Carolina has stations which are heating rapidly (orange) right next to stations which are cooling rapidly (blue.)
High and Low Temperatures | Climate Change | US EPA
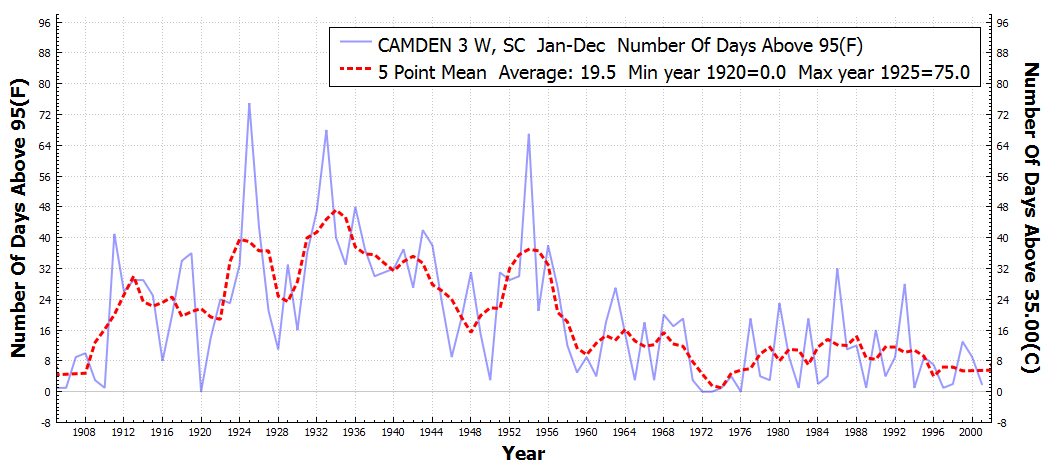
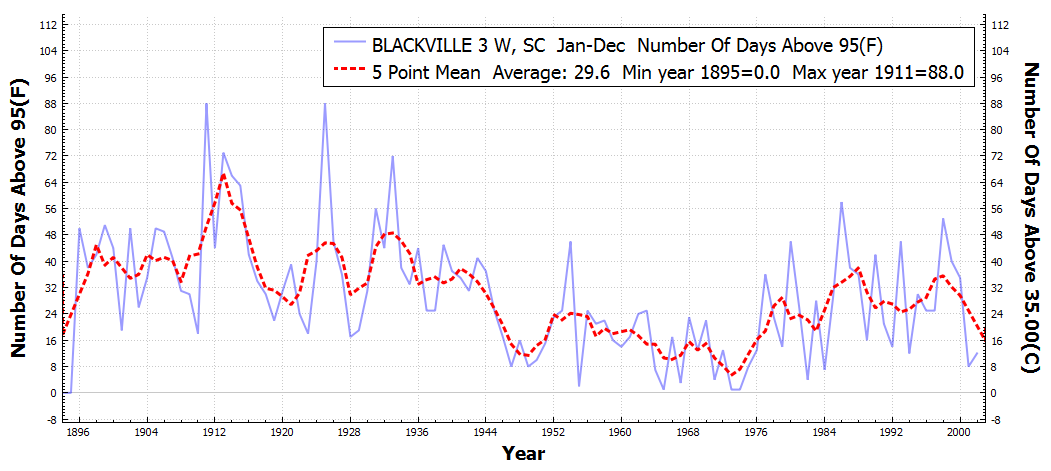
They say the number of hot days at Blackville, SC has increased 28%, while Camden, SC has decreased by 18%. Both are rural stations near Columbia.
Look what they did! The pattern at both stations is very similar over the past 90 years (a large decline in the number of hot days) – but NOAA removed all of the hot pre-1948 temperatures from their analysis, and generated a meaningless statistic dominated by noise.
If the map at top was generated using data starting at 1920, it would be almost entirely blue. They have no reason to exclude pre-1948 data, other than the fact that it wrecks their scam.
