
Criminals at NOAA are claiming that sea level in the San Francisco Bay is rising to catastrophic levels.
Their own data shows that there has been no change in San Francisco Bay sea level for decades.

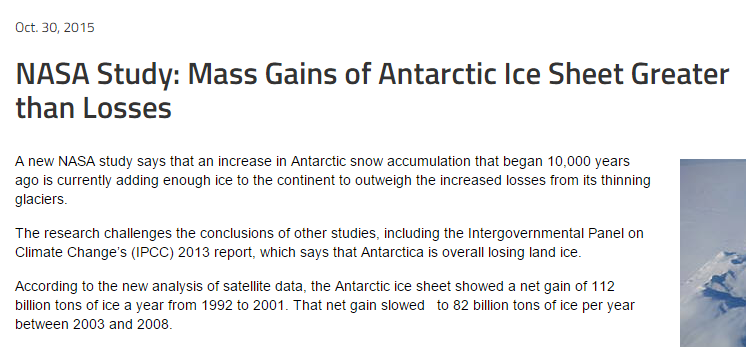
NASA says that Antarctica is gaining ice.
NASA Study: Mass Gains of Antarctic Ice Sheet Greater than Losses | NASA
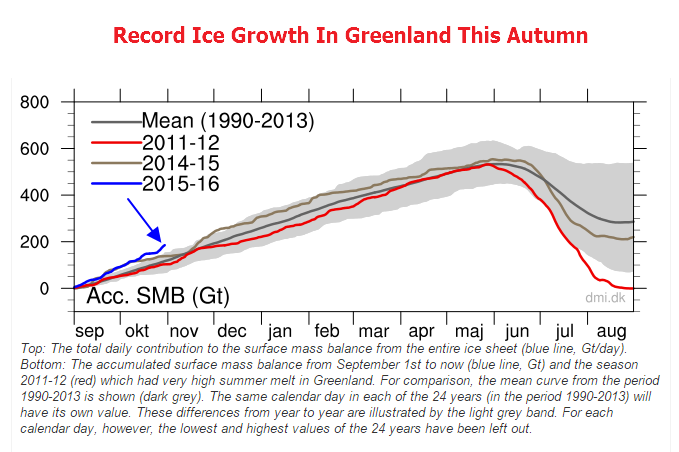
Greenland is gaining record amounts of ice
In summary. There has been no sea level rise in the San Francisco Bay, and no source of melting ice to raise sea level. The NOAA claims are 100% fraudulent, are not based on any science, and only exist to push the White House political agenda.

They are banking that the public is too stupid to know the difference.
They are right. BUT a large segment of the public doesn’t have to know the data or particulars. They have lived their lives with the weather and season and know what is normal within their own experience and what is unusual and don’t give a hoot about what is happening in most of the rest of the world but know that what they are being told is happening where they live just simply is not in their corner of the world.
The really sad thing is that if you asked most of the college age kids that believe the BS the reasons for the change in the seasons they wouldn’t have a clue!
Climate change deniers always leave out the fine print, cherrypicking what YOU’D LIKE reality to be. There is still a net increase in the ocean sea level rise of .23 inches, AS NOTED in the article. READ MUCH? It’s just not coming from Greenland like they thought it was. “SOME OTHER CONTRIBUTION TO SEA LEVEL RISE THAT IS NOT ACCOUNTED FOR.” UNSCIENTIFIC to leave that out.
And trends reveal that in a few decades, compared to a accumulation of 10,000 years, the net losses will be greater than the net gains. OVERALL picture=BAD:
“But it might only take a few decades for Antarctica’s growth to reverse, according to Zwally. “If the losses of the Antarctic Peninsula and parts of West Antarctica continue to increase at the same rate they’ve been increasing for the last two decades, the losses will catch up with the long-term gain in East Antarctica in 20 or 30 years — I don’t think there will be enough snowfall increase to offset these losses.”
” The good news is that Antarctica is not currently contributing to sea level rise, but is taking 0.23 millimeters per year away,” Zwally said. “But this is also bad news. If the 0.27 millimeters per year of sea level rise attributed to Antarctica in the IPCC report is not really coming from Antarctica, there must be some other contribution to sea level rise that is not accounted for.”
The only thing this demonstrates is that there IS a sea level rise rise, but mistakenly attributed to Antarctica. Climate change cherry pickers are still in denial, just want to post the data that fits their narrative.
That is not scientific, that is religious in nature. It is a religion to believe in something that the science contradicts. That in a nutshell is climate change denialism.
http://www.nasa.gov/feature/goddard/nasa-study-mass-gains-of-antarctic-ice-sheet-greater-than-losses/
Correction:
“..Antarctica is… taking 0.23 millimeters per year away,” Zwally said.
There’s STILL a …” 0.27 millimeters per year of sea level rise attributed to Antarctica in the IPCC report…”
BTW, this is what fact-based reporters do–CORRECT errors of fact, instead of doubling down on myths, wishes and hopes (AGW denialism).
Endless spam from the same moron
Apparently you are too unintelligent to post contrary evidence. Your ad hominem attacks equal 100% FAIL.
HABEAS CORPUS.
PRODUCE YOUR EVIDENCE. Science demands it. Scientists do not call names, they look up proof to either support or disprove the theory. If you are truly science-based you will do so. If you are global cooling theory is religion, I guess you will continue to call names. Who does that make a moron??
Who is this idiot?
TEN PEER-REVIEWED PAPERS PROVING SEA LEVEL IS NOT RISING
Notice the area where Roman sea ports are inland is tectonically stable according to NASA.
List of Roman Sea Ports found inland
(Has great pictures and maps.)
For the areas occupied by the Romans it was pretty close to zero or actually sinking! “..the pivot point is rather abrupt; Scotland is still rising due to the rebound effect which is correspondingly sinking England 2 millimetres into the North Sea each year.”
A NASA model of current surface elevation change due to post-glacial rebound and the reloading of sea basins with water. Canada, Northern Europe, and Antarctica are all currently rebounding at a rate of a few millimetres per year. More water in the oceans as a result of ice sheet melting is slowly depressing sea basins. Satellites are used to observe differences over time. http://basementgeographer.com/glacial-isostatic-adjustment/
https://i0.wp.com/basementgeographer.com/wp-content/uploads/2013/05/PGR_Paulson07_big.jpg
STUDY #1
Mid to late Holocene sea-level reconstruction of Southeast Vietnam using beachrock and beach-ridge deposits
Translation the sea level was up to 1.5 meters higher than today in a tectonically stable area ~5000 years ago to 2000 years ago.
STUDY #2
Sea-level highstand recorded in Holocene shoreline deposits on Oahu, Hawaii
This study shows a sea level highstand ~1.6 meter above the present level from ~5500 years ago to 2000 years ago.
STUDY #3
Late Quaternary highstand deposits of the southern Arabian Gulf: a record of sea-level and climate change
This study shows a sea level highstand ~1 to 2 meters above the present level about ~5500 years ago.
STUDY #4
The Quaternary Geological History of the Santa Catarina Southeastern Region (Brazil) 1999
The first part discusses drilling in several locations and analyzing samples. They mention dating prior to that was guesses. “…. A drilling campaign done in the domain permitted the sampling of material for 14C datings, and the obtained data confirmed some previously assumed ages. The sequence of events, that originated the Holocene deposits, has been also reconstructed through drilling and 14C dating of the collected peat and shell samples…”
In the body of the text is this:
This study shows a sea level highstand ~ 4 meters above the present level about ~5000 years ago. With sea level oscillating since then. Not only has the sea levels have dropped since the Holocene Optimum the evidence shows that “warmer paleotemperatures were favourable for great proliferation of mollusks in the area”
Santa Catarina brazil is at latitude 27.2500°S and is tectonically stable.
STUDY #5
Holocene sea-level change and ice-sheet history in the Vestfold Hills, East Antarctica
The above is a RELATIVE sea level. The area is not tectonically stable because the area has isostatic uplift in response to deglaciation from the Wisconsin Ice Age. The same applies to the following study.
STUDY #6
A new Holocene relative sea level curve for the South Shetland Islands, Antarctica
VALIDATION BY ALTERNATE STUDIES
GLACIAL ADVANCE
STUDY #7
Ice free Arctic Ocean, an Early Holocene analogue
STUDY #8
Temperature and precipitation history of the Arctic
STUDY #9
A new approach for reconstructing glacier variability based on lake sediments recording input from more than one glacier January 2012
The highest glacier growth started 600 years ago prior to that most glaicers had melted away.
THIRD METHOD OF VALIDATION
STUDY #10
Sea Level Changes Past Records and Future Expectations
Have they corrected for the 18.6-yearly Luna Nodal cycle? Linear trend lines on sinusoidal curves are very time dependent.
The Dutch who are the most concerned about actual sea level rise have found the cycle.
The Effect of the 18.6-Year Lunar Nodal Cycle on Regional Sea-Level Rise Estimates
Fedor Baart†,‡, Pieter H. A. J. M. van Gelder†, John de Ronde†,‡, Mark van Koningsveld†,§, and Bert Wouters†
(wwwDOT)bioone.org/doi/abs/10.2112/JCOASTRES-D-11-00169.1
Linear trend lines on sinusoidal curves are very time dependent.
“Cooling…German Springs Arriving 20 Days Later Than 28 Years Ago!”
http://notrickszone.com/2015/05/31/cooling-german-springs-arriving-20-days-later-than-25-years-ago/
Darn good read for those interested in such matters. And another example of official government lies.
Hey, “agwisreal3000”, you do realize that sea levels have been much lower, and MUCH HIGHER, than anything seen in modern history, right? That during an interglacial, it’s NORMAL for sea levels to rise, right up until the descent into cold? That the AVERAGE temperature of the earth over the millennia is a full 12C HIGHER than today, with occasional plunges into colder times, like today? Do I really need to point you to the geological history charts, or can you look these things up for yourself when you put down the NYTimes? BEFORE MAN, much more extreme sea levels, and much more extreme temperatures, were “natural”. What ISN’T natural is your cry of panic in a world that simply moves to a different drumbeat than you want it to. It’s innumerate, irrational and uneducated imagination, “cherry picking” the data from recent times to conceal the true natural variability of the rock we live on, and how little we control any part of it.
Post your evidence. If there is any debate at all about global warming it will be based only on evidence, and only pertinent evidence taking into account all other evidence for the phenomenon. If you are a science oriented you should understand this.
Here is why NOAA is spouting nothing but propaganda to confuse people:
The Troposphere straight from SS
http://www.skepticalscience.com//pics/2_atmosphere.jpg
Notice how nice and straight the line is in the troposphere showing temperature change is proportional to the elevation.
It can be mathematically formulated too:
The above is why spotty measurements of the temperature of less than 30% of the land mass are a really really rotten measure. [See retired scientist Ben Johnson’s new research] Satellites at least have much better coverage and are not as influenced by UHI or local RH.
Temperature is an extrinsic property and very much dependent on the moisture content of the air at the time of measurement.
https://chiefio.files.wordpress.com/2010/01/ghcn_giss_250kmnov_anom11_2009_2009_1881_1990.gif
Map created from the data at the NASA / GISS web site by E.M. Smith uses a 250 km ‘smoothing’.
Here is a look at the actual stations used (vs the stations tossed) for Canada. Canada is 3.5 million square miles – or 6.7% of the land area of the earth, and covering latitudes from 45N to 85N. Notice the stations tossed are those in the far north. “..the most obvious ‘hole’ is the lack of stations above latitude 60N. Yukon, Nunavut and Northwest Territories make up 39% of Canada, but between them have only four stations: Dawson and Whitehorse (Y), Eureka and Coral Harbour (NT)…” — Verity Jones
Black triangle are stations in use:
https://diggingintheclay.files.wordpress.com/2010/04/canada-bypopulation.png
https://diggingintheclay.files.wordpress.com/2010/04/canadastations1975.png
“… the scientific justification for each adjustment is” being torn to shreds by REAL scientists.
Here is just ONE example:
Paul Homewood talk to Trausti Jónsson, a senior climatologist at the Icelandic Met Office, who wrote Paul Homewood in 2012, ““The GHCN “corrections” are grossly in error in the case of Reykjavik”. GISS made Reykjavik’s warm 1940 period disappear by reducing the real temperatures by up to nearly 2 degrees. Jónsson wrote that he was unaware that NOAA made corrections to Iceland’s historical data, did not agree with them, and refused to modify Iceland’s own historical temperature records.
Zeke Hausfather stated @ Judith Curry’s
“Back in the 1940s virtually all the stations used liquid-in-glass thermometers, which read about 0.6 degrees warmer in max temperatures (and about 0.2 degrees colder in min temperatures) than the new MMTS instruments introduced in the 1980s. This means that actual max temperatures (as measured by MMTS instruments) would have been ~0.6 degrees colder, and contribute part of the reason for adjusting past temps downwards.” This was based on one very limited study that I already covered a couple months ago.
Klaus Hager carried out a study comparing MMTS and Glass thermometers side by side for a period of 8.5 years and found that the MMTS gave a mean difference that was 0.93C warmer. Klaus Hager is a 44-year veteran German meteorologist and wrote a peer-reviewed paper on his findings. http://wkserv.met.fu-berlin.de/Beilagen/2013/Autom%20WSt_Hager.pdf
Another peer-reviewed study Sensor and Electronic Biases/Errors in Air Temperature Measurements in Common Weather Station Networks by Lin et. al. concluded:
In the peer reviewed study “Air Temperature Comparison between the MMTS and the USCRN Temperature Systems” Hubbard et. al. concluded:
Now Dr. Bill Johnston a retired scientist has found the same problem with Australian MMTS temperature records and a lot more…
On the quality of Australia’s temperature data by Dr. Bill (WH) Johnston.
(Former NSW Department of Natural Resources Senior Research Scientist.)
Finally the problems with the MMTS is graphically represented by the incident at at Heathrow Airport.
CONCLUSION: NOAA’S ADJUSTMENTS ARE NOT JUSTIFIED!
Comments in the local press here in the Bay Area indicate a sea change rise in skepticism.
See my 8 day old comment at the link to the ABC 30 Action News story above
Wondering if my science based post will get through the religious babble being posted here…???
A complete moron
What Religious based babble? YOU are the one who has fallen for the Cult of Global Warming. I have too much science background as a professional scientist to fall for the nonsense spewed by third rate hacks working for the criminals now occupying the government. (I am not a Republican and I am not a Christian either.)
Science is not equivalent to religion. It is based on evidence that fits realistic theories. Religion is 100% hearsay although there may be some facts in the religion. The facts in the religion do not prove the rest of the claims and hearsay is real.
Facts or evidence that seemingly point to global cooling–which apparently contradict the overwhelmingly proven global warming–do not constitute proof or sufficient evidence of global cooling.
I think what we are witnessing with your thinking is you believe, like a religion in global cooling and in the failure of global warming theory. You find tiny things to support your theory but you completely ignore the overwhelming preponderance of evidence against it.
That, honey, is known as a religion. You believe in something only because you believe in it previously and other opinion leaders believe in it. People who fit your way of thinking you approve of their ways of thinking. Regardless whether science and evidence is involved. That’s a religion.
If evidence you claim to have found supporting global cooling is so strong, why hasn’t it been supported in the scientific journals and by the IPCC? It’s because the science isn’t good enough to support it or isn’t overwhelming enough to upend the overall theory.
I don’t think you understand the nature of science. I think you should read up on the scientific method. Science is always being upended and changed–but only if the evidence is strong enough to do so.
Dude,
I AM a scientist!
I spent close to forty years running chemistry labs. I have had to make sure all of our equipment was calibrated, INCLUDING THERMOMETERS, test methods were written and followed and data archived. I got stuck conducting government inspectors (FDA and FAA) on plant tours explaining what we were doing and why. I was in charge of retained samples and THE DATA. If I pulled the crap NOAA has I would have ended up fired at best or behind bars.
I also had the great misfortune of working with government scientists, and I use that term very loosely. They were all about playing politics and not about science.
Speaking of retaining samples and archiving data, this is exactly what the UN (FAO and OIE) and the WTO demanded that farmers do when they wrote the Draft Guide to Good Farming Practices. link (The draft is long gone though I have a copy.)
So what about PROFESSIONAL GOVERNMENT SCIENTISTS?
In Australia BOM admitted this year that no one can replicate their work, and they will not help anyone do it either.
The BOM said it was too complex and required too much “operator intervention”, and was a “supervised process”. Their decisions cannot be written down and published even in a peer reviewed journal for fellow experts. Therefore it is not possible to replicate their methods.
Phil Jones of CRU claims that his precedessor destroyed the raw data in the 1980s. However Jone DOES say in the Climategate emails that he had planned to destroy any data/information rather than actually accede to a FIOA request….
Across the world some of the old records have been saved.
The BOM has discarded all the data from before 2000 yet Mr Cole WATCHED his father record that data.
That is only one of many times records are hidden from independent researchers or destroyed.
<b.If it is not REPEATABLE, and VERIFIABLE it AIN'T SCIENCE!
(Remember Cold Fusion?)
About the greenland Ice Sheet is to add that the annual ice loss through calving is not included in thr graphs and illustrations. The yearly average net loss of Greenland Ice is about 250 Gigatonnes per annum and contributes to the sea level rise with about 0.7mm.
Even the Danish Meteoroligic Institute has no own accounting for calving and relies on NASA.
NOAA shows the ICE loss in this graph.
http://www.arctic.noaa.gov/reportcard/images-essays/fig3.3-tedesco_sml.jpg
Except the high melting in 2012, The ice loss is the same for 12 years now.2014 it cam just back to normal.
Those numbers are meaningless, and were derived from the same methodology which was used to generate the flawed Antarctica numbers – which NASA just debunked.
I’m warmist, but we depend on data to some idea. NOAA data may have some bias, but they show that even if there is some ice mass loss it is not catastrophically accelerating.
If we citeData from the DMI, we should also add that they said they depend on the Satellite data to get the full picture.
In climate discussion there is not only Black/White but a lot of grey between.
they also coincide with the upward leg of the AMO index.
That AMO index has now reversed and over the next decade or so Arctic sea ice will continue to increase.
You can base the Arctic Sea Ice fraud on just a small period from 1979, or you can do a bit of research and realise that at the moment it is anomalously HIGH compared to the first 3/4 of the Holocene, when zero summer sea ice was the norm. That’s because the Earth’s temperature is only a small amount above the coldest period in the last 10,000 years.
The link to the NOAA report is here:
http://www.arctic.noaa.gov/reportcard/greenland_ice_sheet.html
Why ever should we believe NOAA when they are notorious for adjusting the data to suit the CAGW narrative and have just flipped the finger at Congress when asked to support those adjustments.
If I pulled the crap that NOAA does, the FDA would have had my ass in jail and tossed the key!
Yes they adjust the data out of some reason, but do we have any better? Even the adjusted data show nothing dramatic.
Greenland ice melt according to the NOAA data is about 0.7mm per year minus 0.23 from added Antarctic ice is less than 0.5 mm sea level rise per year. For over hundred years the observed average sea level rise is about 1.5mm/year. Nothing dramatic is happen.
The picture may change as the AMO/PDO are eversing than even Greenland is melt will stop finally.
When we use NOAA and NASA data to prove something, we cannot refuse the rest we don’t like. That also would be kind of Cherry picking.
There are at least six good reasons not to buy the hyped alarm about Greenland melting.
https://rclutz.wordpress.com/2015/10/29/greenland-is-melting-really/