
In 2001, NASA showed just under 0.6C warming from 1880 to 1999
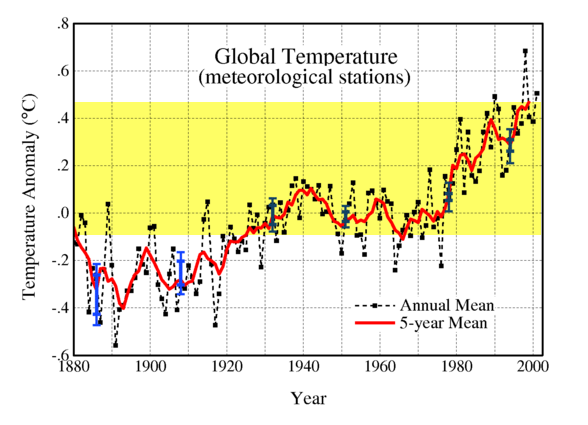
Now they show just under 1.2C warming during that same interval.
The next graph overlays the two above at the same scale, with the Y-axis normalized to the 1880’s. It shows the dramatic alterations NASA has made over the past 15 years, in an attempt to hide the failure of global warming theory.
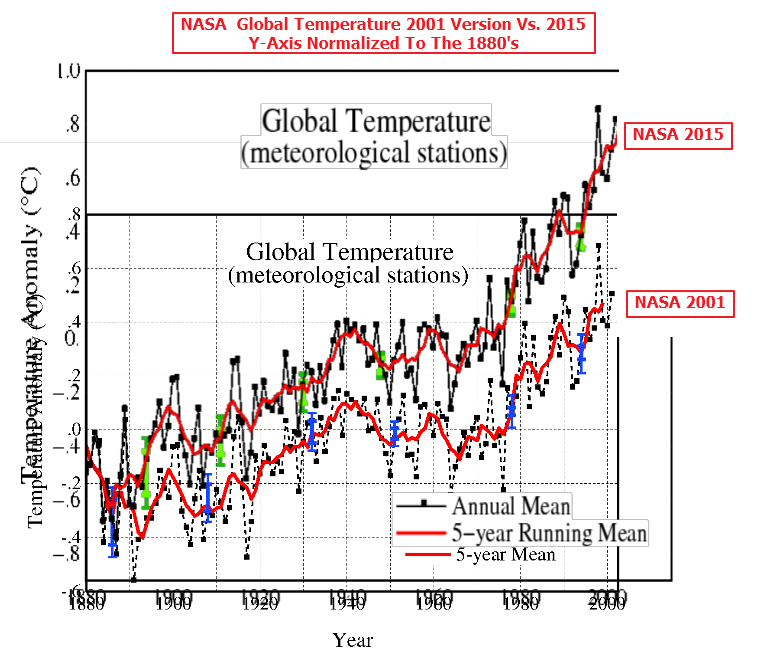
Note above that they have altered the data far outside of their own blue and green error bars. A smoking gun of scientific malfeasance. The graph below shows the magnitude of their post-2001 data tampering.
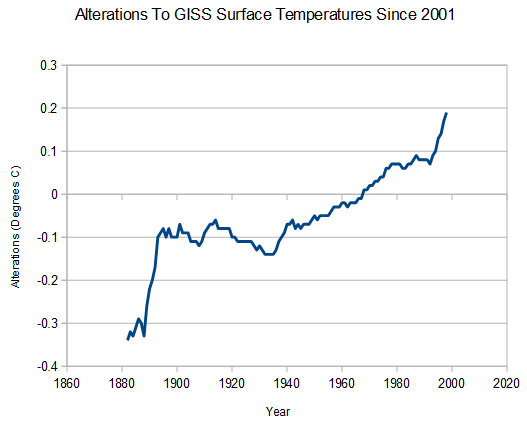
But their fraud is much worse than it seems. Since 2001 they have continued cheating, and have created a completely fake warming trend – during a time when the satellites showed that the planet was cooling.
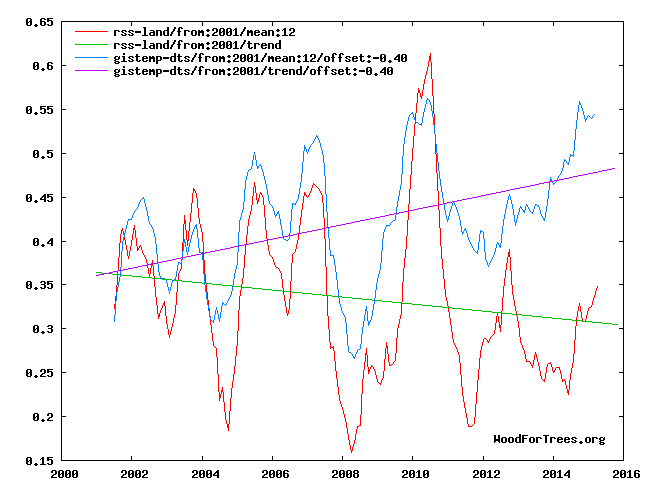
NASA land temperatures are diverging linearly from more accurate satellite temperatures since 2001. A smoking gun of fraud.

Ninety-seven percent of climate scientists base their research on fraudulent data from NASA and NOAA.

Is the NASA 2015 presented above post Karlization?
GISS was caught red handed more than once doctoring their output to increase temp. RSS and UAH are the only reliable sources for global temperature IMO.
In 2001, NASA showed just under 0.6C warming from 1880 to 1999
Now they show just under 1.2C warming during that same interval.
The same crap is going on with sea level.
Steven, once again, you have shown nothing but the obvious fact that NASA and NOAA, as well as all the other climate database maintainers (including Roy Spencer, BTW), periodically update their data to correct for biases and errors as they become known. Correcting for biases and errors is not evidence of fraud. But forget about fraud, just show that any adjustment to any dataset is incorrect. You have never done that, as far as I can tell. You haven’t done it this time, certainly. You have to show that an adjustment is incorrect.
Adjustments to data sets is the definition of science fraud.
Once data is adjusted it is no longer “data”, it is simply an artifact of analysis.
Well said Gator. ‘Adjusting’ data will get you fined or tossed in jail in accounting, quarterly stock reports, engine emissions testing or batch analysis in drug manufacture.
On top of that the data has been continually ‘adjusted’ This alone says the error is huge and the significant figures added are bogus.
Given that the best data set in the world from the USA has 64.4% of the data with an error of greater than 2° C and 6.2 % with an error greater than 5° C
>>>>>>>>>>>>
At that point you get into even more statistics.
Dr. William M. Briggs is an Adjunct Professor of Statistics at Cornell
Netherlands Temperature Controversy: Or, Yet Again, How Not To Do Time Series
<blockquote"Today, a lovely illustration of all the errors in handling time series we have been discussing for years. I’m sure that after today nobody will make these mistakes ever again. (Actually, I predict it will be a miracle if even 10% read as far as the end. Who wants to work that hard?)….
Lesson 1 Never homogenize.
….so far, four time series now spliced together….
Lesson 2 Carry all uncertainty forward.
If you make any kind of statistical judgment, which include instrument changes and relocations, you must always state the uncertainty of the resulting data. If you don’t, any analysis you conduct “downstream” will be too certain. Confidence intervals and posteriors will be too narrow, p-values too small, and so on.
That means everything I’m about to show you is too certain. By how much? I have no idea.
Lesson 3 Look at the data.
Lesson 4 Define your question.
Everybody is intensely interested in “trends”. What is a “trend”? That is the question, the answer of which is: many different things.….
Years of experience have taught me people really hate time series data and are as anxious to replace their data as a Texan is to get into Luby’s on a Sunday morning after church. This brings us to our next lesson.
Lesson 5 Only the data is the data.
Lesson 6 The model is not the data.
The model most often used is a linear regression line plotted over the anomalies. Many, many other models are possible, the choice subject to the whim of the researcher…
since we don’t like to go against convention, we’ll use a straight line too…..
And say, wasn’t it kind of arbitrary to draw regression line starting in 1997? Why not start in 1998? or 1996? Or whatever? Let’s try:
http://wmbriggs.com/blog/wp-content/uploads/2014/11/nd4-300×195.jpg
More fun with statistics:
Real Climate Temperature “Trend” Article Gets It Wrong (Like So Many Do)
“just show that any adjustment to any dataset is incorrect. You have never done that, as far as I can tell.”
You’re not looking. Here are two examples I found in about 30 seconds:
https://stevengoddard.wordpress.com/2014/06/01/what-is-the-time-of-observation-of-a-non-existent-temperature-reading/
https://stevengoddard.wordpress.com/2015/07/29/what-is-the-real-value-of-tobs/
No, Doug, neither of those shows any data to be incorrect.
Martin, please allow me to ask what must seem to you like a hypothetical question. Suppose — just suppose! — that NASA and NOAA were, in fact, fraudulently changing the data. Suppose that they were (for whatever reason) knowingly and willfully increasing the trend from what was recorded by measurement to a warmer trend. Suppose that you became (for whatever reason) suspicious of their actions. Short of having them confess under oath and stating clearly, “yes, we fudged the data!” what sorts of things would you look for? What hints and clues would indicate to you that the “scientists” were only pretending to be honest? This sort of analysis is done all the time for almost any fraud or crime, anything from bank robbery to embezzlement to murder. What would be the clues that would indicate to you that there had been fraud in the temperature record?
First, the recent NOAA adjustment, the one that Lamar Smith is creating a tempest about, actually reduces the trend. Lamar and Steven either didn’t notice that, or they are deliberately ignoring. To answer your question, you would look at the explanation of the change and decide whether it is correct or incorrect (which reviewers have done). Then you would look at the adjusted data and decide whether it had been done correctly, according to the explanation (which reviewers have done). There would be specific tests to perform for different explanations. For example, some particular type of measurement device might be found to have a bias. Then you test it against a known correct device. Or, for example, kriging may have been used for infilling. By now, kriging has been found to be skilful, but you could test it by taking actual measurements and comparing them to kriging infill data. There are many other tests that can be tried, and there can be much analysis of the mathematics used in the adjustment and of the analysis used in the explanation. I suspect no one here can do any of this (I can’t), but that doesn’t mean one can simply display the effect of an adjustment using before and after graphs and call it fraud. But that is what Steven is doing.
There are no clues you can see by comparing datasets before and after. You have to find fault with the actual adjustments, and the way you do that is by finding errors in the methodology and mathematics.
“First, the recent NOAA adjustment, the one that Lamar Smith is creating a tempest about, actually reduces the trend.”
More accurately, it decreases the trend for some periods and increases the trend for others. The trend since 1880 decreases slightly. On the other hand, the increasingly embarrassing flat trend of the last going-on two decades gets disappeared in the process. That is a very good trade off from a public relations point of view. “What pause? There never was a pause!”
“To answer your question, you would look at the explanation of the change and decide whether it is correct or incorrect (which reviewers have done).”
Reviews have not done so — or more accurately, reviewers have not openly done so. Certainly some reviewers have claimed that they have done so, but claims are not evidence and certainly not proof. When I asked you to explain the changes made to just one year, 1880, you responded that you were unable to do so. Blind faith is not science. After looking and asking for the better part of a decade now, I have been unable to find anyone — ANYONE — who can actually explain why and how the adjustments are made, or why the adjustments are done over and over and over without even a pretense that the newer changes are being done in response to any sort of new information or rationalization. NASA and NOAA refuse to be transparent about the process. No transparency equals no science.
Martin, would you take any medicine that a company produced, with the supporting data, that was altered to the extent that it showed that it was SAFE and effective. With the reviewers of that altered data to have a vested interest in the product being approved.
On a side note welcome back Gail we have missed you
The Icelandic Met office is on record saying that the adjustments to the Reykjavík data are “grossly in error”
https://notalotofpeopleknowthat.wordpress.com/2012/01/25/how-giss-has-totally-corrupted-reykjaviks-temperatures/
Climate scientists for many years have predicted a hockey stick warming trend and dire climate consequences without huge taxes and regulations. Climate scientists have also been “adjusting” raw data to cool the past and warm the present to fit their past predictions and maintain their multi-billion dollar agenda. Hard to believe this is all just “coincidence” on the part of honest scientists. Does not even come close to passing any reasonable smell test!
“You have never done that, as far as I can tell.”
That is because – unlike Steven – you lack both the erudition and motivation to actually do the research necessary to make such a decision, so instead of that you concentrate on attempting to discredit Steven personally..
You’re just another sad little Warmie playing the man and not the ball.
It appears to me from what I have read over the years that it is both the mathematically modeling and the temperature recording methodologies and instrumentation used that are plagued with problems. One of the papers I remember reading was about how the calibration of the equipment, they different equipment brands, the quality of the equipment and where they were specially located. For instance, the east side of the building vs the west side of the building for each temp gauge, how old the temp gauges were and how the different brands compared as to the quality of their performance. Apparently all temperature gauges are not created equal. Of course you also need a wind gauge nearby because wind effects the temperature and that, logically should be factored in.
Having done weighted average calculations of a cash flow stream involving a large group of boat and mobile home loans, I was kind of surprised, when the buyers, sellers and myself all came up with different yields for the two portfolios and this is a pretty simply formula as compared to what I understand the math modeling is for temperature assessment. I give this analogy because I want those readers who may not understand, how subjective this can be because of the assumptions that are required to be made for any evaluation like this. As an ex-appraiser, we are required to specify the “Assumptions and Limited Conditions” we made in every appraisal we did and if you read the scientific papers on climate research, they are filled with them. Because of this and many other factors is one of the reason I am not convinced that global warming is even occurring, much less caused by mankind. As science matures, we keep finding out that some of the old theories were wrong and I hope this is the case with catastrophic global warming. It was a hot summer here in Florida but then again, I can’t remember every having one that wasn’t. Lol
Also, you refer to “the satellite data,” when you are only using one portion of one satellite dataset. There are two. Saying “the satellite data” gives the false impression that your graph uses all the satellite data. It doesn’t. Furthermore, even if the divergence in your graph is real, it doesn’t mean the NASA data is incorrect. Maybe the RSS data is incorrect. The graph, if it shows anything, it shows that there is a problem in one of the two datasets depicted, or both, but since the NASA data pretty much agrees with all the other datasets, except the RSS land data, doesn’t that suggest that it is more likely that the RSS land data is wrong? I mean, given the difficulties for acquiring surface measurements by satellite? You neglect to mention that problem.
UAH version 6 data is almost identical to RSS. Both sets of satellite data show the same thing. Satellite data is far more accurate and far less problematic than surface temperatures
There is no reason to claim the satellite data is more accurate. It isn’t even temperature data to begin with, and the algorithms used to infer temperature from the data are based on a model, which is updated from time to time. The algorithms are also updated from time to time. But you don’t call these adjustments fraud. You don’t object to them at all. You claim satellite data is the most accurate (without supporting evidence). Still, your divergence graph, if it shows anything, shows there is a problem somewhere, but it does not show that the GISS data is incorrect. You have to show that an adjustment to GISS is incorrect. You haven’t done that.
No reason? How about these reasons:
1. Covers the whole globe, including all the continents where there is no surface data.
2. Covers all oceans.
3. Is blind to UHI because urban areas are tiny dots on the map that aren’t even seen
4. In immune to government data tampering
5. about 10 more reasons
“But you don’t call these adjustments fraud.”
Sceptics have no problem with adjustments per se; we only demand that the adjustments be documented and justifiable. It is one thing to say “we are adjusting the satellite data because the orbit has decayed by x amount and here is how we compensate” and another thing completely to say “here is the new and improved interpretation of the data” without saying why and how it was modified. Yes, I know that NASA gives broad reasons such as “we adjusted for time of observation” but that is not a clear reason and the “how” is left completely in the dark for many of their changes. Adjustments can be justified or not. We are against unjustified — and giving no explanation at all is unjustified.
“You claim satellite data is the most accurate (without supporting evidence). ”
Some of us remember when the satellites were launched. The projects were approved only because they would allow more accurate data than was available from the ground stations. That argument was made decades ago and any quick research on the subject should be enough to convince you.
Jason, the adjustments are documented, and they are justified. Satellites do “allow” for more accuracy in that they cover more area, and they do “allow” for more accuracy as our understanding of how to interpret the data they record improves. But the two systems use different algorithms, as far as I know, and they can’t be used to measure surface temperature where there is cloud cover. They measure microwave radiance at different altitudes in the troposphere. Temperature is inferred from these radiance values.
Martin Smith says:
November 9, 2015 at 2:07 pm
Jason, the adjustments are documented, and they are justified.
Zeke Hausfather claims MTS sensors read .5C cooler than LiG thermometers, however, in controlled observations MTS actually read .9C warmer than LiG’s. So in other words, the “justified” adjustments are at best incorrect and calculated by inept dyslexic scientists.
http://www.augsburger-allgemeine.de/bayern/Meteorologe-findet-Diskussion-um-Klimaschutz-laecherlich-id32569342.html
Marty buddy maybe you’re not paying attention. Yes a model is used to some extent for both RSS and UAH but here’s the money quote, are you listening? They are BOTH checked against radiosonde balloon data! Yikes yes Marty they’re actually fact checked against actual thermometers.
And here’s another money quote for you Marty. According atmospheric physics and global warming theory the lower troposphere where the satellites take their measurements should be warming 20% faster than surface temperatures! But according to all of the surface temp data sets it’s the surface that is warming 20% faster! So Marty who’s wrong/right here?
RSS, UAH are VALIDATED against radiosond balloons
Over the USA, RSS and UAH cooling trends match very closely to the COOLING trend in USCRN and ClimDiv. This match to the most pristine of surface data in the world VALIDATES the data collation of the satellite data.
But I doubt you have heard the word “validates” in climate science, and certainly would have no idea what it actually means.
REAL DATA is being very unkind to your religion, isn’t it, child-mind. ! 🙂
That is why you must reject real data whenever it is put before you.
but even YOU admit that there’s alot of data out there that shows cooling, including temperature data, and the fact that satelite data shows cooling proves the whole AGW theory is garbage when you guys are over there ‘hockysticking’ and telling everyone (or insinuating) that NOW is the hottest ever – that was obviously bullshit so now your trying to cling to a few pieces of warming data that nasa,noaa managed to ‘adjust’ .. how bad is it going to be as we approach 2020, and the 2030? at waht point does the whole AGW theory get relegated to the garbage can of history? how long can you hold on?
RSS and UAH closely agree. Others directly tabulated by the government continue to diverge from those two showing warmer temps that seem to try and at least keep some of the models projections plausible. Why?
And NOBODY, despite diligent searching, has been able to find the hot spot signature in the troposphere over tropics which the positive feed back “physics” of the AGW hypothesis requires. Why?
Now I gotta go. Depart for McDonough, GA (Just south of Atlanta) with what will no doubt be a heavily loaded refer trailer full of Nestles product at 08:00 this morning. The question is I-65 to I-24 to I-75 and thus go through heavy construction on I-65 and traffic in Louisville, and Nashville? Or I-74 to I-275 to I-75 and miss the worse of the traffic but deal with the hillier terrain south of Lexington? It’s a crap shoot. Think I’ll deal with the hills this time. Either way there is not way of avoiding the Atlanta BS but taking the western route around the city, while longer, is considerably faster during higher traffic times.
The heavy construction on I-65 and traffic in Louisville especially at the bridge was a royal pain this summer when I drove through it.
Martin Smith says: “There is no reason to claim the satellite data is more accurate….”
As usual Martin is blindly chanting Religious dogma.
Yes there is every reason to think the land bas data is LESS ACCURATE than it was even twenty years ago!
The Great Dying of Thermometers: ‘It’s obvious how well documented temperatures were (once) in US. The decay of system in last 20 years is stark’
https://www.youtube.com/watch?v=58mDaK9bH5o&feature=player_embedded&lang=en
by Piers Corbin (meteorologist and astrophysicist)
Facts and data are immaterial to Martin. He has only his religion, and will defend it with whatever LIES and MISDIRECTIONS he thinks he will get away with…
… to be caught out and exposed for a lying, deceitful little twerp every time.
Andy,
Martin the Troll picked the wrong blog to try and pedal his childlike disinfo. It is a battle of one whiny Lib armed with a ‘water pistol’ against scientists and engineers armed with ‘AK 47s’
Even our Truck driving friend RAH, not to mention our banker friend GATOR are much more than a match for most Warmists. (No disrespect for either who I highly respect even if I argue with them.)
“whiny Lib armed with a ‘water pistol’ ”
Even that water pistol is firing blanks. 🙂
AGW is a thermometer count artifact
The article goes into the nitty gritty of the calculations and why the method is wrong.
I already mentioned Kriging and that it is a bad method because the earth is not a uniform billard ball, the assumption needed to make kriging valid. Heck krigging doesn’t even work on the small area of my farm because the geology changes. Dry wells on the south and gushers of 60gal/min on the north. Superb loam in one area, brick making clay in another and pure gravel in a third. Sampling Paradox
Here is an illustration of how kriging is used to cheat in the global temperature set
GHCN – GIStemp Interactions – The Bolivia Effect
It is the MANN-made Hockey stick method all over again. Choose the stations that show CAGW and purge the stations that do not.
https://chiefio.files.wordpress.com/2010/01/ghcn_giss_250kmnov_anom11_2009_2009_1881_1990.gif
And then there is the problem of ocean affected vs inland data not being at all the same. Since the two different types of terrain give completely different temperature profiles over time you CAN NOT STATISTICALLY COMBINE THEM! And you certainly can not use shore data to estimate or correct mountain or inland data. This alone makes the land based temperatures suspect.
The Original Temperature Project
UAH 6 beta versus RSS: http://www.dh7fb.de/reko/uah6rss.gif .
You can compare on monthly timescale. Only very small divergences (at most in 1999…2000) and the same linear trend with a rest of 1/100 K/decade 🙂
The point is Steven is claiming fraud by showing the difference between the data before and after adjustment. That doesn’t show anything except, of course, that the data have been adjusted. Which is the whole point.
Martin I will attempt to help you out here on the fraud and adjustments to data and make it a little more personal.
Suppose you were stopped for drunk driving in January and given a breath analyzer test using a infrared spectrophotometer but the test showed you only had a
BAC of .6 (which is below the .8 legal limit) you were not charge with a DUI.
Now fast forward to August and your city is running out of money it expected from fines and levy from court. Then the police department said that the breath analyzer was calibrated wrong by .2 Now all the BAC test that showed persons stopped and tested that had a .6 BAC really had a .8 BAC. So now you were charged with a DUI because of the adjustment. And of course just before you went to court to try your case the police department said there was a further error and instead of just a .2 adjustment the machine was recalibrate and it was off by .3 not the original adjustment .2. And since you are an additional .1 over the limit your fine just increase by a 1000 dollars
Now based on the cities need for court revenue and police department being part of the city would you not call that fraud and demand to see all emails and correspondence from city finance and the police department or would you just go to court and pay your fine
I really like that example. (Radar speed detectors are just as bad…. like the well known tree clocked at 86-MPH in Florida.)
Thanks for your valiant attempt, scott, but it doesn’t make sense. You are committing the same error as Steven because you are assuming that the .4 bias in the breathalyzer reading is fraudulent. So your example shows nothing. To claim fraud in your example, you have to offer evidence that the police are lying about the .4 bias. Your example sounds outrageous to begin with, but your are actually just committing the same logical fallacy as your Dear Leader Steven.
Martin, my example is spot on. First and foremost there was no .4 bias in the example (please reread). Second would you not want to find out how the bias was found and if supporting data was not voluntary supplied by the police/prosecutors office during discovery. You lawyer would certainly want to see ALL relevant data (including email and correspondence) surrounding this revision and would be well with in his/your right to see them. That would include depositions by the mayor, head of finance and the chief of police.
The very idea that you can change numbers on a data sets and offer a vague reason for doing so would certainly lead to question that demand answers.The evidence fraud would be founding the emails correspondence and deposition. You have probably never taken a civil or criminal case to court and would not know that this type of evidence (fraud) would only be found by digging thru the above mentioned evidence.
And YOU have not done your homework. Steven has done short pieces on different aspects of this fraud for years. So yes it is FRAUD. And Yes Steven has proven it. And Yes you do not know what you are talking about.
Several other people have also proven the fraud and tried to get JUSTICES or at least answers and every single time have met stonewalling white washing and sweeping under the rug.
Once is happenstance.
The Dog Ate the Data (UK)
Twice is coincidence.
The Goat Ate the Data plus all the dancing around
Three times, it’s enemy action.
If it can’t be replicated, it isn’t science: BOM admits temperature adjustments are secret
Australian government finally gets slightly serious with CSIRO board and Abbott wanted to investigate BOM data, Hunt opposed “due diligence” and with the latest Palace Coup (Goldman Sachs President Turnbull ousts Abbott) there will be NO INVESTIGATION. (So Australia doesn’t even rate a Whitewash.)
And the fourth time PROVES IT!
The US government’s main climate research agency has refused a request by House Republicans to release key documents concerning the controversial issue of whether or not there has been a “pause” in global warming. —. NOAA Attempts To Hide The Pause In Global Warming: The Most Disgraceful Cover-Up Since Climategate
“Gosh. What vital information of national secrecy importance could NOAA possibly have to hide?”
Remember an American President was forced to turn over tapes that were a heck of a lot less important than this key piece of ‘Data Adjustment’
If there was a ‘pause’ if the effect of CO2 is slight (as is increasingly obvious)
If the models were based on the wrong architecture as is obvious from comparison to the real data
https://wattsupwiththat.files.wordpress.com/2013/09/ipcc-vs-gw_slowdown.jpg
http://clivebest.com/blog/wp-content/uploads/2011/06/plotcomp1.png
http://www.climatechangedispatch.com/images/stories/pics3/CMIP5-global-LT-vs-UAH-and-RSS.jpg
Then the would be Totalitarian Globalists lost their best weapon for disguising their intentions of driving the middle class back into abject poverty and serfdom.
But they have a few back-ups lined up…
http://www.cfact.org/wp-content/uploads/2015/05/Cartoon-Climate-Change-Threats.jpg
Martin, you are a genuine half-wit who is immune to actual information, aren’t you?
There is no shame in admitting it…you are just not very bright.
hey everyone use logic not character defamations.
Logic and data and facts are irrelevant to martin.
Pearls before swine.
We tried logic. It does not work on a Marxist.
This is why there is so much emphasis on a “Consensus” It is “resulting objective phenomenon” external reality has no place in the mind of a brainwashed Marxist. The debate is over and it is now time to move on to “options for mitigation and adaptation. “
The IPCC mandate is:
So it never was about understanding the climate. It was really about “options for mitigation and adaptation. “ and this is the change wanted by the Globalists like the UN, the World Bank, and the WTO.
The IPCC’s ROLE
So there it is again. ONLY “human-induced climate change” is of interest and that is why you see very little work done on natural climate change.
Here’s the official definition of Climate Change
That’s from the official UN Framework Convention on Climate Change (http://unfccc.int/essential_background/convention/background/items/2536.php). or
https://web.archive.org/web/20140913102734/http://unfccc.int/files/documentation/text/html/list_search.php?what=keywords&val=&valan=a&anf=84&id=10
The term specifically excludes all natural climate change, and even excludes any caused by humans due to, for example, land clearance or city building, considering only atmospheric changes.
Impressed Gail good job. My ladies (bugs) have been released. 1500 of the buggers.
FYI: The fundamental basis for Marxism, as socialism, is pretty simple. The group is more important then the individual. For intense, the people of the USSR had very little rights but only privileges granted to them by the ruling oligarchy. The individuals rights are legally inferior to the public good, hence and why in our society today there are is much public policy. We have abandoned, all except for the basis rights, most of the protections in favor of the public good. The problem with this is groups don’t actually have rights that should extend any further then the rights of the individuals within the group. Capitalism, the unfettered variety, is just the opposite, no force or legalization of force, thus only voluntary actions can be used. With Natural Law as it is called, rights are protected because they are considered inalienable. As we see in our society today special interest groups dominate our society because we have allows especially our property rights, through some 115 +/- different tax and regulatory fees to have legal priority over individual rights. The more money the group has, the more money that can be used to gain special benefits at the expense of everyone. I like to explain this to people in the manner to show them just how important the protection of inalienable rights really is. Like I post many time. How can taking property from those who it rightfully belongs to and giving it to those it doesn’t rightfully belong to, promote integrity and a civil society. Of course if you ask any social engineer, they know everything and have all the answers. lol
What Tony is presenting to us is a crude statistical analysis. The baseline assumption is that scientifically justified adjustments should go in both directions, and come in similar numbers and magnitudes. That may not, in fact be a proper assumption. But NASA’s own error bars prove that they work under the same one. Yet the adjustments they make are almost invariably in directions that improve the correlation with their hypothesis. The overwhelming majority of adjustments before 1980 are downward, and the overwhelming majority after 1980 are upward. Again, the working assumption in science is that adjustments to measurements should have little to no effect on long term trends. In this case, the adjustments constitute fully half of the trend. I accept the possibility that every adjustment they’ve made may have been proper. But that’s not enough to show that today’s numbers are more accurate than the original measurements. The scientific method is to propose a hypothesis, then do everything you can think of to disprove it. When the adjustments are so one sidedly in favor of the hypothesis, it’s only natural to question how much effort is being put in to finding errors that would cause adjustments counter to the hypothesis. Even more so, when you consider that the majority of those counter trend adjustments have come from laymen, outside the establishment.
Far more importantly, the numbers they publish today are well outside of the range they previously gave as possible. It’s not even close. After adjusting the numbers to an extent considerably greater than what NASA previously said was possible, they NARROWED the error bars. There’s not some pool of error being drawn down. Confidence goes DOWN with each error identified, not up. When the adjustment surpasses the original error bars, the original measurement has been statistically invalidated. By NASA’s own numbers, if the adjustments are correct, the underlying data is useless. Continuing to adjust invalidated data does not fix it.
Ted, brilliantly stated!
AMEN!
At this point the error swamps any signal.
Reblogged this on Centinel2012 and commented:
Have no doubt that this is true! This is the result of a corr put federal government that controls the science though federal funding. The only way to stop the corruption of science is to stop the federal funding. Those pigs that the feed at the trough obey the dictates of the farmer, until he takes them to the slaughterhouse.
Marty, white flies. Now that’s another real problem. It’s really hot here in So. Florida I admit, but my tomato and pepper plants are loven it. Martin, do you have any suggestions for white flies. Maybe check with NASA. Just poking a bit of fun. Actually I do have a white fly infestation. I have some lady bugs coming to the rescue. I’m organic so I won’t use the synthetic poisons. I distrust the multinationals as much as I do the government. There has always been a propensity for those in science to do and say whatever they need, to continue to get government funding. Thus, you should not necessarily trust what they say or do. It’s like sports figures and doping. Why would Lance Armstrong dope? The big money is in winning. Jobs are not easy to get and government funding even more difficult. Many a good person, has sold their soul for a buck.
Good grief if you want some lady bugs I have hundreds. They manage to get in the house and collect near the ceiling this time of year where I carefully collect them and toss them back outside. I wait a bit until after they have cleaned up any other insects that have gotten in through the open door. I watched one tangle with a spider and win. They are like vacuum cleaners and wipe out all the other insects that might make it into the house.
The door we use faces west and is nice and warm so it collects lady bugs every fall. Amazing little critters.
They literally just came in the mail about 1/2 hour ago so I’m going to release some in my greenhouse and the rest in the yard. A total experiment, I have no idea how many of them to use.
Actually, those are not Lady Bugs, but an Asian species…
Harmonia axyridis is a large coccinellid beetle. Its colour ranges from yellow-orange to black, and the number of spots between none and 22. It is native to eastern Asia, but has been artificially introduced to North America and Europe to control aphids and scale insects. It is now common, well known, and spreading in those regions, and has also established in South Africa and widely across South America.
It is commonly known as the harlequin ladybird (because it occurs in numerous colour forms). It is also known in North America as the Ladybug, and (because it invades homes in October in preparation for overwintering) as Halloween lady beetle.[1][2] In Japan, it is not generally distinguished from the seven-spot ladybird which is also common there.
https://en.m.wikipedia.org/wiki/Harmonia_axyridis
Thanks gator. Boy do they ever invade homes for over wintering!
The first time I encountered them was on a float trip in the Ozarks about ten years ago, and we were being bitten by them. They have since migrated north and I get them here now. I haven’t been bitten since my first encounter, but I did have one leave a nasty orange stain on a t-shirt once.
Yes they do nibble. I had one who insisted on trying to bite me most of last night. (I still rather a lady bug vs a spider.)
That’s why you have to be scientifically literate, hski. Most people who post here appear not to be. Sorry I can’t help with your white fly problem. Good luck.
Yes, they have to learn more about orbital mechanics. Ha ha still laughing.
Morgan, the change in albedo of the Arctic Ocean is one of the leger positive feedbacks caused by AGW.
Hey Marty, there is no sun in the Arctic Ocean in the winter, and during the summer when the sun actually rises (to it’s scorching 23 degrees above the horizon), all the one-year sea ice melts and the only sea ice left is the multi-year ice which covers a tiny fraction of the sea ice. So I’m just wondering, what change is there in the albedo if most of the ice always melts every summer anyway.
I’m asking you, because you are the expert in Orbital Mechanics.
its not it’s. Sorry
Morgan, the change in albedo of the Arctic Ocean is one of the alleged positive feedbacks caused by melting ice there.
Fixed it for you! AGW is not a fact, it is at best a hypothesis.. There is currently morte ice in the Arctic than the average of the past 9000 years. Why do you alarmists cherry pick this recent cold spell as your mean?
A peer-reviewed paper published in the Canadian Journal of Earth Sciences finds that Arctic sea ice extent at the end of the 20th century was more extensive than most of the past 9000 years. The paper also finds that Arctic sea ice extent was on a declining trend over the past 9000 years, but recovered beginning sometime over the past 1000 years and has been relatively stable and extensive since.
-Holocene fluctuations in Arctic sea-ice cover: dinocyst-based reconstructions for the eastern Chukchi Sea Canadian Journal of Earth Sciences, 45: 1377-1397
“That’s why you have to be scientifically literate, hski”
But you aren’t Martikins, not by the remotest stretch of the imagination.
So what are you doing embarrassing yourself and making yourself look foolish on this blog?
“Most people who post here appear not to be”
Poor Martin, most of the postings are your mindless waffle.
Have not shown one tiny piece of scientific literacy in the whole few months of you pusillanimous ramblings.
It is really funny to see a mental drone like you commenting on the scientific literacy of others.
Scientific literacy is something you have absolutely zero knowledge of.
Sorry for typos etc, working on small laptop at the moment.. need bigger screen.
I’m trying a black light- They appear to be attracted to a certain light spectrum.
Even if there is global warming, what would we do? The cement industry alone creates about 5% of the emissions, therefore cut down even more trees. Stop flying planes, driving autos, riding on trains. Build more high costly and inefficient wind and solar farms that have high carbon footprints to build. Sometimes I think my girlfriend would rather die then be without A/C. I think I more worried about the pollution and things such as the nuclear problems.
hski, all we have to do is stop using fossil fuels to generate electricity and to power cars.
All we have to do is build a million more bat choppers and thousands more bird scorchers
All we have to do is shut down civilization, abandon science and technology. and embrace the dark-ages and become cavemen.
There aren’t enough caves. We need to kill billions of people so the few survivors can fit in the caves.
There aren’t enough caves.
That ‘s what the bat choppers are for.
“There aren’t enough caves. ” oh, but there are, or will be. Hi-rise caves of steel and glass. And don’t forget the underground parking garages and subway tunnels. 😉
“That ‘s what the bat choppers are for.”
Ahhh.. green jobs.. scraping out the bat guano to make the caves liveable for humans.
Just remember. No power, no low-end software engineers.
Marty is planning his next job, as a hand guano scooper.
Bats will be extinct by then, every species chopped like a 1949 Mercury
“hski, all we have to do is stop using fossil fuels to generate electricity and to power cars.”
You’re deranged.
“hski, all we have to do is stop using fossil fuels to generate electricity and to power cars.”
That should be simple. I’ll just rummage in my closet and pull out the old hand cranked air conditioner. Then I’ll go to the garage and dust off my wind-up automobile.
As the owner and builder of an off-grid cabin, I can tell you from personal experience that we humans do not have the current technology to do away with fossil fuels without killing off probably 95% of the people on this planet. If we pushed alternative nuclear technologies we could perhaps do a change over in the next half century or so. Maybe.
Agreed, but it’s not so easy to do this. Although getting cheaper, wind and solar are still quite expensive. I actually thought I invented a water and wind turbine but did not get the patent. The company I sold it to didn’t try to defend it. Both myself and my partners (Engineers) think they used it to just do a pump and dump.
Reblogged this on Canadian Climate Guy.
Reblogged this on Climate Collections.