
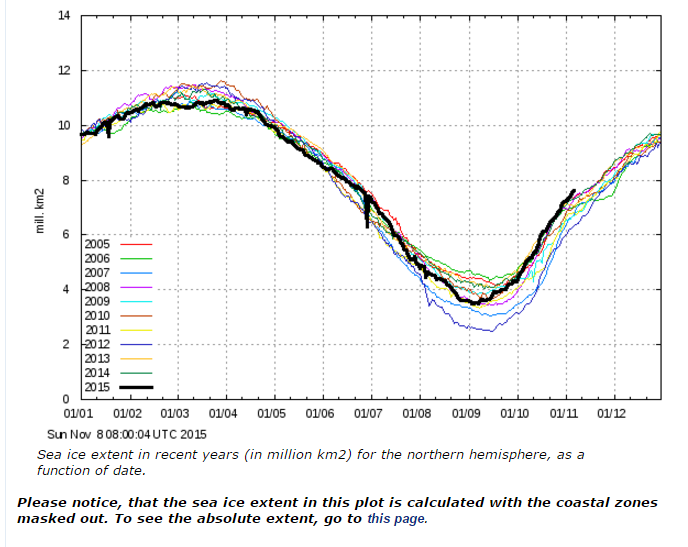
The Danish Meteorological Institute produces this graph of Arctic sea ice extent, which is the best graph available from any data source. It shows Arctic ice growing at a record pace, and the highest of any year since at least 2004.
The features of this graph which make it more meaningful than the largely useless graphs from NSIDC and other sources are :
- They show the extent of 30% concentration ice, rather than 15%. This is a smaller number, but a better indication of the condition of the ice.
- It masks off don’t-care coastal zones.
- It shows the full range of years going back to 1995.
- They don’t tamper with data, like NSIDC did on April 17, 2012

I believe it’s time to include years from the last Century ; the sea ice growth is climbing over everything on the top graph!
Steven, Arctic sea ice is not growing. It is shrinking.
You didn’t explain why coastal zones are “don’t-care.” Arctic sea ice extent includes all the sea ice in the Arctic, in this case, where the density is at least 30%. There is no reason to mask out any of that ice, and you know it. Therefore, the graph you are displaying is the wrong graph. This is the correct graph: http://ocean.dmi.dk/arctic/icecover.uk.php And here is the explanation, from the Danish Meteorological Institute, for why it is correct and why the graph you posted is incorrect:
“The plot above replaces an earlier sea ice extent plot, that was based on data with the coastal zones masked out. This coastal mask implied that the previous sea ice extent estimates were underestimated. The new plot displays absolute sea ice extent estimates. ”
And here is the graph of the Arctic sea ice trend for October: http://nsidc.org/arcticseaicenews/files/2015/11/Figure3.png
As you can see, Arctic sea ice is not growing. It is shrinking, and much more rapidly than it would do naturally.
You can’t possibly be as stupid and illiterate as you pretend to be.
You posted a claim that is demonstrably false.
I demonstrated why it is false using the data.
Your response is to call me names.
Stevens graph is the CORRECT graph to use. It is consistent in its formulation and goes back over a much longer time than the new graph.
This consistent long term graph shows that Arctic sea ice, using a consistent matric is now ABOVE ALL YEARS SINCE 2005.
This is what the REAL DATA shows.
You moronic aversion to real data is quite understandable for a low -level brainless troll.
You are repeating yourself, Andy. I have made my point, and none of you has refuted it.
You have done nothing BUT repeat your erroneous claims.
Its all you have. Because you are an idiot.
And stop crying abut being told what you are.. Its pathetic.
You know you are here ONLY as a zero information troll, don’t expect to be treated as anything else.
Look in the mirror and ask yourself why you are here.. Certainly not to learn anything, because you have proven that you are incapable of it because of your brain-washed ignorance.
You have produced NOTHING to refute, just baseless claims.
The data IS NOT false, and you have not demonstrated it to be false.
It is a consistent metric, that shows that the current sea ice level using that metric is now higher than any year back to 2005.
You need to accept that FACT and stop yabbering meaninglessly.
Martin is of course right. But he’s a bit wrong as well. Drawing a linear trend line for a non-linear process is misleading. And if your trend depends on mixed pixels, it might be not robust.
“You can’t possibly be as stupid and illiterate as you pretend to be.’
He most certainly is, SG.
And I don’t think he’s pretending.
Wer t what trend line? It is each years data plotted.
Martin ; the short melt season minima turned noticeably approx two weeks earlier this year and that is NOT concurrent with the first site Graph you presented. The second site references a questionable NSIDC graph… that has no credibility ( nsidc being in the pockets of Obama ).
Shrinking may exist with your grey matter… the Ice & Snow stuff is growing…
http://media.cagle.com/205/2014/01/27/143546_600.jpg
http://media.ourstory.com/11/77/91/25ee81ee77b82306c31f7ce1a4268d8faba96982/9281731847a820e2f518ef9e8a5a06c110ce50c6-l.jpg
What goes up comes down…
http://oi61.tinypic.com/2cxbxw4.jpg
Gail that’s great ; one other picture, to cover all possibilities is a “Clown”.
I thought for a while that Trollsmith is just one of the countless lazy progressive loons and if Goddard gives him enough rope he’ll hang himself. I was wrong. He’s a rare specimen in a class of his own: An industrious troll. Nobody has to give him rope. He will mow Goddard’s lawn and run his errands so he can buy it himself.
https://coloradowellington.files.wordpress.com/2015/11/troll-running-errands.jpg
Colorado, did you really not understand that I was talking about the trend? If you think that this seasonal increase in Arctic sea ice is important, please explain the importance. It does this every fall and winter.
Good troll, good troll, keep laboring …
That’s actually the answer I expected, Colorado. No answer.
You are such a lovable troll. Everyone can track your labors on this blog. You ran away from questions before. Keep pedaling …
What questions? Please ask them again. I missed them.
https://coloradowellington.files.wordpress.com/2015/11/troll-try-again.jpg
Troll smart! Troll like game? Good troll.
Can Smith play?
No, he can’t. Smith downgraded.
Crickets. No show. Martin Smith tells falsehoods and runs away when called out. A garden variety troll.
Keep pedaling, Speedy …
Marsh, I demonstrated why Steven’s claim is false, and your response is to claim that the NSIDC has no credibility because it is “in the pockets of Obama.” Steven showed the graph for the current year, which says absolutely nothing about the trend. You appear not to have noticed that. It is the trend that is important, not what is happening right now. Nevertheless, the current Arctic sea ice extent is more than one standard deviation below normal according to both the Danish Meteorological Institute. and the NSIDC.
http://arctic.atmos.uiuc.edu/cryosphere/arctic.sea.ice.interactive.html
use this graph then.
You have not demonstrated anything.
You don’t have the capability or the data to do so.
The REAL DATA as in the consistent long term graph, using a consistent shows that SG is TOTALLY CORRECT.
He isn’t using a long term graph, andy. Look at the x-axis. It represents one year. The graph depicts the monthly sea ice changes for one year. What do you learn from it?
This graph is a much longer term graph than the new one you want him to use
http://realclimatescience.com/wp-content/uploads/2015/11/2015-11-08-04-27-31.png
And it clearly shows that this years Arctic sea ice extent is higher than any all of the years right back to 2005.
It is using the same metric for all data for each year.
Your continued moronic rejection of reality and facts is quite hilarious.
You really need to go back to junior high and get some sort of basic education.
Smarty Marty says “He isn’t using a long term graph, andy. Look at the x-axis. It represents one year. The graph depicts the monthly sea ice changes for one year. What do you learn from it?”
No, the x axis represents a year and the colored lines represent years going back to 2005.
This Martin troll really is an ignorant little twit isn’t he. !
“It is the trend that is important, not what is happening right now”
How is at least the last 10 years “right now”?
If you want to talk long term trends, show us an accurate trend for the time period of which humans are supposed to have had a significant influence on the climate, i.e. the industrial era.. Starting from about 1900 would probably suffice.
Martin,
I got a chuckle out if you using the word “correct” to describe the 15% graph.
The 30% graph is not “incorrect”. Rather it allows us to focus on the denser ice towards the Pole, which is of interest because the ice volume has been growing, despite the “warm” AMO not being quite over, and the “cold” PDO being in a “warm” spike, (due to the so-called”blob”.) Because of the current (likely short term) warmth of non-arctic oceans, both the Atlantic and Pacific entrance regions of non-arctic water have below-normal ice extents, but these coastal areas are not as influential in the 30% map. Therefore the 30% map allows us to focus more on what is hidden, to a degree, by the 15% maps.
People have a bad habit of cherry-picking their maps and graphs, and avoiding the ones that provoke thought, because they disagree with preconceptions. You may accuse our host of cherry-picking the 30% map, however he does so to counter the blatant cherry-picking, (and sometimes outright fraud), of mainstream propaganda. And I ask you, would you see the 30% graph at all, if it were not for our host?
I myself wish there were 50% and 70% and 90% graphs as well. The more information we can get, the broader and deeper our views are likely to get. There may be such a thing as TMI (too much information) when a friend or daughter is describing their weekend, but there is no such thing as TMI in science…unless your skull has limited space and gets overwhelmed easily.
Try not to limit yourself with your choice of graphs. That “trend” graph you were so kind as to share starts in 1978, which was a high ice extent year. The trend looks different if you start in 1972. Also the 15% extent graph is higher than we might expect, considering the current state of the AMO and PDO. It should whet your curiosity, and make you seek views of the central arctic, to see why the ice there is denser. Here is the PIOMAS graph for sea-ice volume, which has stopped sinking and may suggest the tide is turning, despite a warm El Nino, despite a warm AMO, and despite a warm spike in the PDO. I am very curious about what factor (the Quiet Sun?) might be overruling the other factors.
https://wordpress.com/post/44117707/12629/
I am very thankful our host offers balance to the mainstream propaganda, and think you should be thankful too. Many who do not always agree with him turn to this site on a regular basis, to get the news other sites miss.
Keep seeking, keep searching, and keep wondering. The arctic is full of marvels:
https://sunriseswansong.wordpress.com/2015/11/06/micro-critters-rule/
My mistake. Here is the PIOMAS graph, (I hope):
https://sunriseswansong.files.wordpress.com/2015/11/volume-20151107-bpiomasicevolumeanomalycurrentv2-1.png
Thanks for the graph, Caleb. It shows Steven’s claim that Arctic sea ice is growing is false. Arctic sea ice volume is falling. You can’t think Steven meant Arctic sea ice is growing because the northern hemisphere is going into winter. That would be a silly thing to say. And yet that’s the only thing his graph shows.
Yes, it shows the bottoming out in 2012 and the recovery since.
See how it “bottomed out” in 1982? What you call “bottoming out” is natural variation. i.e. noise.
Martin has ZERO understanding of maths,
ZERO understanding of the AMO,
and in fact ZERO understanding of anything.
Arctic sea ice is now starting to climb since the AMO has started to reverse.
Arctic sea ice is still ANOMOLOUSLY HIGH compared to the rest of the Holocene.
That is because the globe’s temperature is still only just a small amount about the COLDEST period in the last 10,000 years.
But of course Martin will totally ignore these facts.
He does not have any understanding or comprehension of any of them
>And I ask you, would you see the 30% graph at all, if it were not for our host?
Yes, Caleb, I would, because it is published at the Danish Meteorological Institute website, which I visit. That’s how I know the graph is misleading; the Danish Meteorological Institute says it is misleading and posts the link to the correct graph. It isn’t the 30% that is misleading. The explanation is here: http://ocean.dmi.dk/arctic/icecover.uk.php This graph agrees with the 15% graph at the NSIDC: http://nsidc.org/arcticseaicenews/ The point is Steven’s claim that Arctic sea ice is growing is false, let alone growing at a record pace. Right now, Arctic sea ice is growing because the Arctic is going into winter. That’s all that Steven’s graph shows. The trend of Arctic sea ice extent, no matter whose graph you use, is down.
Martin, to compare like for like…you would use the “old” to compare to the “old”….not the new
Latitude, it isn’t new. It’s wrong. It’s wrong because it leaves out part of the Arctic sea ice extent, a part that happens to be shrinking.
It’s also wrong to use either the old or the new graph for the purpose of claiming Arctic sea ice is growing. It’s wrong because the graph is not a trend graph. Arctic sea ice is growing right now because the Arctic is moving into winter. This growth has nothing to do with the trend in Arctic sea ice, which is down.
Martin Smith says:
November 8, 2015 at 4:37 pm
It’s also wrong to use either the old or the new graph for the purpose of claiming Arctic sea ice is growing. It’s wrong because the graph is not a trend graph. Arctic sea ice is growing right now because the Arctic is moving into winter. This growth has nothing to do with the trend in Arctic sea ice, which is down.
—————————————————————————————————-
The trend is down compared to the high it was at in 78. But that’s the “trend” and Steven said nothing about the trend but what is actually happening NOW concerning the RATE at which the growth is occurring. I’ve come to the conclusion your reading comprehension skills are very poor MS or you just don’t want to understand because it does not agree with your preconceived notions about what is supposed to have happened but isn’t. Anyway attempt to imply that people are saying things they aren’t isn’t going to fly here.
Ok, rah, but then proclaiming that Arctic sea ice is growing right now, even at a record pace, is saying nothing, because it is November, and the Arctic ocean always begins freezing in late September and by November, is freezing rapidly. It means nothing with regard to global warming/climate change/AGW, or whatever you want to call the issue.
There is currently more ice in the Arctic than the average of the past 9000 years. Should we be worried about this “abnormal” build up of ice? Winter is coming…
I understand how you all view Arctic sea ice decline:
http://www.skepticalscience.com/graphics/ArcticEscalator2012.gif
1980 was 9000 years ago? 😆
You are even dumber than you give yourself credit for.
That’s the answer I expected, gator. Thanks again.
That’s the answer I expected, gator.
What? That 2015 – 1980 = 9000? 😆
Really now MS. This is getting unhealthy. First off you suckers picked a loser when you went for Arctic Ice extent as some kind of gauge for over all NH temperature. Arctic ice is sea ice. Many factors other than temperature and insolation effect sea ice extent and thickness. Storms, currents, tides, winds, and even the salinity of the water can change the extent, area, or volume of Arctic ice and do so far more quickly and dynamically than changes in water or air temperature or insolation can.
Yet, despite the abject failure of so many claims that the Arctic would be “virtually ice free” during the summer months by now, you people insist that it’s a viable gauge. And when the current data on ice growth doesn’t agree with what you’ve expected to happen what do we get? Endless lines of BS trying to change the subject of the post or making false claims that the plot used was the “wrong” one, or that it was “doctored”.
Give it up man. Your really not helping yourself or your cause here.
rah, there were no scientific claims that the Arctic would be ice free in the summer by now. All three of the Arctic sea ice trends are down, and they are down more than was projected.
Give you a piece of advise. Start harping about the 2016 tropical storm season. It’s looking more and more like there is a good chance the Atlantic storm season is going to be a dozy next year and probability is high that the US may actually get hit by one or more major storms there by breaking the decade long hiatus. It may even be like 2005 and I bet you’ll really get excited about that and start going on about just as if there was never a lull when it was predicted there would be increased severe strikes on the US.
I won’t take your troll, rah. This year has been bad enough.
Arbitrary focus on hurricane wind speed has birthed a new climate myth
http://www.theguardian.com/environment/climate-consensus-97-per-cent/2015/nov/03/arbitrary-focus-on-hurricane-wind-speed-has-birthed-a-new-climate-myth
Poor Martin, again sucked in by gaurdian crap.
Arctic sea ice continues to grow from its low point , which just happened to coincide with the peak in the AMO..
Just like the high point he likes to start with starts at the very low point of the AMO, thus showing only the downward leg of the cycle.
Cherry-picking in its absolute.
He is an extraordinarily DUMB person who has ZERO understanding of the AMO cycle and how it affects Arctic sea ice. He also has a massive aversion to anything resembling real data.
He will thus remain totally ignorant for the rest of his scared, panicky, low-level troll of an existence.
Martin Smith says:
November 8, 2015 at 6:52 pm
rah, there were no scientific claims that the Arctic would be ice free in the summer by now. All three of the Arctic sea ice trends are down, and they are down more than was projected.
_________________________________________________________________
Many many claims by scientists that it would be ice free. Thanks to the great work done here by Steven many are cataloged at one place.
https://stevengoddard.wordpress.com/ice-free-arctic-forecasts/
And then there are other sources:
https://wryheat.wordpress.com/2015/04/11/predictions-of-an-ice-free-arctic-ocean/
“BBC December 12, 2007: “Arctic Summers Ice-Free by 2013”
The BBC’s 2007 report quoted scientist Professor Wieslaw Maslowski, who based his views on super-computer models and the fact that ‘we use a high-resolution regional model for the Arctic Ocean and sea ice’. This story was within a more rational story in the Daily Mail.”
http://www.theguardian.com/environment/earth-insight/2013/dec/09/us-navy-arctic-sea-ice-2016-melt
http://news.bbc.co.uk/2/hi/7139797.stm
Arctic summers ice-free ‘by 2013’
By Jonathan Amos
Science reporter, BBC News, San Francisco
“Arctic summer melting in 2007 set new records
Scientists in the US have presented one of the most dramatic forecasts yet for the disappearance of Arctic sea ice.
Their latest modelling studies indicate northern polar waters could be ice-free in summers within just 5-6 years. ”
And so on and so forth.
Martin Smith says:
November 8, 2015 at 6:57 pm
I won’t take your troll, rah. This year has been bad enough.
Arbitrary focus on hurricane wind speed has birthed a new climate myth
http://www.theguardian.com/environment/climate-consensus-97-per-cent/2015/nov/03/arbitrary-focus-on-hurricane-wind-speed-has-birthed-a-new-climate-myth
——————————————————————————————
You really buy into that CRAP! Too funny. You really can’t think for yourself can you.
These claims about the most powerful storm ever are BS! FACT: For the majority of time hurricanes have been recorded there has been no satellite data and limited recon when they are out to sea but only a record of what it was at landfall over the course of the instrument record prior to the satellite era . Thus we have NO FRIGGEN RECORDS of what the pressure reading or power of a storm at sea was for the vast majority the record before satellite data was available. Storm chaser data is strictly limited to the time the flight was in the storm taking it’s measurements.
As a rule the pressure in most storms begins to rise as they approach land, and the cases where this doesn’t happen are the relativity rare exceptions. Thus when these IDIOTS start harping about the strongest storm ever they simply do not have the data to claim that. All they can legitimately claim is that a storm had the lowest pressure ever recorded and that is a totally misleading statement if not put into context I have described above.
Don’t believe me? Watch a great meteorologist with a very good record of Tropical storm prediction explain it to you here in the Saturday Summary video:
http://www.weatherbell.com/saturday-summary-november-7-2015
Using a different measurement , Arctic sea ice has now passed all but 2014, and is still growing strongly.
With a few days it will be within one standard deviation of the mean.. ie PERFECTLY NORMAL compared even to the downward leg of the natural cycle.
This is certainly ANOMOLOUSLY HIGH compared to most of the rest of the Holocene
During the first 3/4 of the Holocene the Arctic sea ice was mostly non-existent in summer.
The reason that Arctic sea ice is so anomalously high is because the globes temperature is still only just a small amount above the coldest period in the last 10,000 years.
These are FACTS that the moronic alarmist trolls like Martin cannot allow into their child-like minds.
Martin Smith says, “there were no scientific claims that the Arctic would be ice free in the summer by now.”
ROTFLOL!
The Arctic sea ice is growing. It started to re-grow from natural low part of its cycle a few years ago as PIOMASS graphed elsewhere clearly shows..
The longer term, consistent methodology graph from DMI clearly shows that the Arctic sea ice level is above all years back to 2005.
Just because you don’t like REAL DATA, doesn’t mean it is wrong.
The level of Arctic sea ice is still anomalously high compared to the first 3/4 of the Holocene, that’s because we are only just out of the coldest period in the last 10,000 years.
Even the so-called ‘mean” on these graphs is meaningless because it is based mostly on the coldest part of the natural AMO cycle.
http://igloo.atmos.uiuc.edu/cgi-bin/test/testimage.2.sh?first=20121102.jpg&second=20151102.jpg
Why can’t I get the Crysphere Today comparative dates arctic ice image jpg to post?
Ah well guess I just try to link.
http://igloo.atmos.uiuc.edu/cgi-bin/test/print.sh?fm=11&fd=02&fy=2012&sm=11&sd=02&sy=2015
Thanks. I forgot how open the Beaufort Sea was in 2012.
Jumping into the Arctic. They finally have a couple videos showing Airborne airborne ops with snow skis. Our technique was similar but the skies were exposed and not wrapped and ours were rigged behind the left shoulder against the parachute pack tray instead of in front of the shoulder as they do it now. You always jump the ramp when jumping skis. You have to careful when jumping the ramp to leave some space between jumpers. If your too close to the previous jumper the deployment bag from his chute will hit you in the face and give you a bloody nose or worse. In SF with experienced jumpers we could cheat and get a tighter stick by alternating going off the left and right side of the ramp but that is not a practice used in other airborne units because they have less experienced jumpers in the mix. My first jump with my fist SF team was with full combat equipment and skis in subzero weather onto an ice covered DZ at night from the ramp of a C-123 Provider.
Then and now the skis are secured with an upper tie down attached to the chute harness near the left shoulder and and a lower tie down around the left thigh of the jumper. Both tie downs are rigged with quick release knots. After exiting the aircraft the jumper checks his canopy and then releases the lower then upper tie downs. Peace time minimum jump altitude is supposed to be 800′ AGL. Once the jumper has descended to less than 100′ AGL he releases his rucksack and it falls to the end of it’s 15′ long lowering line which is attached to the chute harness where the reserve parachute clips on. The skis then slid down that line and ride on top of the rucksack. However, if your going into the trees you ride the whole damn mess in still attached to your body.
Believe me, you don’t feel the cold while all this is going on. Your too busy.
https://www.youtube.com/watch?v=2I2u7Y8dfrM
Thanks for sharing that.
I think even a so called “lay-person” who has first-hand experience of the arctic is miles ahead of a so-called “scientist” who has never left his warm computer, and lives in a virtual reality. Perhaps such a scientist should be called an “unlay person”, rather than a scientist.
Not that there aren’t some pretty obnoxious scientists tromping about in the arctic. Some are publicity-hounds who get their picture taken cuddling baby polar bears, never mentioning the mother bear is seriously drugged nearby, nor that the radio-collars attached to her may be too tight and, as she gets fat for winter hibernation, cause bleeding and perhaps even strangulation.
https://sunriseswansong.files.wordpress.com/2015/11/polar-bear-bleeding-polar-bear-radio-collar_cbc-oct-28-2015.jpg
http://polarbearscience.com/2015/10/28/sickening-effect-of-satellite-radio-collars-polar-bear-researchers-dont-want-you-to-see/#more-68379
However even bumbling bear-chokers own a certain humbleness that comes from actually walking that stark, white landscape, and actually doing field studies, and it comes across in their correspondence. It is an arctic awareness that computer modelers flippantly disregard, or perhaps are blissfully unaware of.
First-hand experience trumps the bliss of ignorance, which makes your sharing valuable. Thanks again.
Caleb, one things those guys are doing that we never did was wear their arctic mittens when jumping. Notice the mittens have an index finger to allow the shooting of a weapon. The trigger guards on our primary small arms were made to open up for easier operation with gloves. But there was no way we would jump with those bags on our hands. In case something goes wrong you need the dexterity and there is no time for pulling off mittens. I would jump with tactical nomex gloves with the fingers and thumb exposed.
I can’t match your experience. I’ve jumped from high cliffs into deep water, but never from an airplane, let alone up where it is so bleeping cold.
I noticed a non-jumper who seems to be double checking the jumpers. Is that what he is doing?
Also there was a bit of a pause before the final fellow jumped, in the video. Was that a glitch? It seems you wouldn’t want to land too far away from the rest.
When the Russians open the Barneo base in Aptil tourists pay over $10,000 to go up and do less than you got to do for free. But in the background you can see the Russian arctic troops training.
I imagine arctic warfare is sheer hell, and not even Russians want to get sent to the dreaded “Russian Front”.
The non jumper is a “safety”. A “safety” is a troop that is Jump master qualified. He assists the Jump master and is free to handle any problems that may come up such as making sure jumpers have their equipment on right, helping jumpers up that sometimes fall, keeping the stick tight, and generally standing back to watch for unsafe acts. The Jump master is just too busy to do all that. After they jump he will drag the parachute deployment bags back into the aircraft. Unhook the static lines and roll the individual bags with their static lines up and put them in a kit bag and then on landing make sure that stuff and any other Army gear still on board the Aircraft gets taken off and ends up back at where it belongs.
The late jumper was almost certainly a result of an equipment problem that delayed his jump and with that kind of delay he would be at least a mile away from the rest of the stick. That is unless they just make another pass over the DZ (Drop Zone) to send him out and that part was cut from the video. Our DZs were NEVER as big as the one they were apparently jumping on.
One other thing. They jumped in White Vapor Barrier (VB)boots sometimes called “Mickey Mouse” boots. We never did that. We would jump in our Hanwag 3/4 shank leather Alpine boots. Their ski bindings are strictly for cross country. Ours had Silveretta Alpine touring bindings which can be used for either cross country or you can lock the heel down for down hill skiing and VB boots did not fit in those kinds of bindings and even if they did they just wouldn’t work for downhill skiing. Besides we needed the 3/4 shank climbing boots for use with Crampons. We used VB boots in certain circumstances when not skiing but they were in the rucksack for the jump and they were the less bulky black ones. Ours were rated for -20 F but I wore them in temps colder than that for sustained periods and never got cold feet. The real danger from VB boots for days is immersion foot.
Thanks for all your interest. We are repeating ourselves again, so, again, I’ll withdraw. Maybe I should only reply to Steven Goddard from now on. Thanks again, folkens.
Always withdraw without learning anything or accepting any bit of REAL DATA.
Its your way.
You will remain perpetually ignorant for the rest of your life.
That means that even as a troll you will remain well and truly on the bottom rung of the ladder.
Troll smart! Troll win! Troll run!
https://coloradowellington.files.wordpress.com/2015/11/troll-on-bicycle.jpg
Yep, just another ZERO INFORMATION troll.
And he seems totally intent on staying that way.
stevengoddard says:
November 8, 2015 at 12:54 pm
You can’t possibly be as stupid and illiterate as you pretend to be.
Caleb says:
November 8, 2015 at 2:17 pm
People have a bad habit of cherry-picking their maps and graphs, and avoiding the ones that provoke thought, because they disagree with preconceptions. You may accuse our host of cherry-picking the 30% map, however he does so to counter the blatant cherry-picking, (and sometimes outright fraud), of mainstream propaganda. And I ask you, would you see the 30% graph at all, if it were not for our host?
THIS is the Steven Goddard (aka Tony Heller when it suits his purpose) that you all look up to? To keep you informed of what? Malfeasance in science? To justify cherry-picking, the ‘other guy started it’ is a reasonable?
Look, please just be neutral for a minute, and see that Martin made a reasoned, valid point. To call him stupid and illiterate is the instant response of your hero, Tony? Then everyone piled on. How f”’ing lame is this site? You guys actually see political motivation in science, yet this site screams politics from the rafters.
Moronic, slimy troll alert.. again
How F**ing lame is this MoreGit guy. !!
He’s right from a hole in the bottom of a fetid stinking barrel.
It’s just more Martin Smith….
“this graph”……..”It shows Arctic ice growing at a record pace, and the highest of any year since at least 2004.”
true
Yep. A consistent methodology which shows Arctic sea ice level under that consistent methodology are now higher than any year back to 2005.
Trolls seem to be REALLY HURT by facts. 😉
exactly….and that’s why they left the old way still up
so you can compare like for like
Either way…..extent is within the margin of error….so it could just as well be a record high
Mogur2013,
I’m sorry you failed to see my point.
Martin stated the 15% graph was “correct” and the 30% graph “is the wrong graph”. I was attempting to explain the usefulness of the 30% graph.
Later Martin claimed using the 30% graph “is demonstrably false.”
It sounded to me like he felt the 30% graph should be abolished, stricken from the records, erased.
The point I was trying to make is that the 30% graph is a tool, and should be used with due respect to its limitations, as a tool.
All the various graphs and charts and maps from the arctic have their limitations. If you email the various people involved you discover they are quite frank about the limitations they deal with. They will explain exactly why their map shows no ice on Hudson Bay, for example, while another map shows ice.
Surely it is better to be frank about what the limitations are, and to have a reasonable discussion about what we are seeing, rather than to dole out a blanket condemnation of someone who simply states what a particular graph is showing.
Wow. Really? Calling anyone not agreeing with you moronic and a ‘slimy troll’? I see that the scientific standard is in play, here. “We can’t refute the science, but we can f”’ up the fetid stinking barrel that Tony thinks is amusing, here. By here, I mean that anyone that wants to crap in the barrel is welcome. How exactly is this a scientific refutation of accepted belief? I am just floored. Please make this go away.
The preceding public service announcement was brought to you by….Smith Klein
You are not moronic and a slimy troll. You are the standard poster here. Only scientists are slimy and on the government dole. How better can liberal totalitarians keep your redneck assholes tight? Can we mention equal health care for all? That should tighten your bunghole.
..makers of Thorazine
Latitude, do you not have ANY longitude? Maybe your pharmacological overlords don’t allow for new information, but… there are people that think you are too horizontal. You might want to try to relax and stop beating your kids. Oh, so sorry, I really didn’t mean to imply that you regularly beat your kids, I only meant that you occasionally abuse them. Maybe you stopped beating them. That is good.
Do you see how that spurious accusations are the bane of scientists?
…bringing happiness to misanthropes one day at a time
Latitude,
The brevity of your wit is absolutely superb, and a joy.
🙂
When you get over your rancid, foaming spittle laden incoherent tantrum..
Then you can try posting something that is actually worth reading.
Mogur alert
Your every post here is a slime-laden load of spewed vitriol, so don’t try and take the high and mighty path, its pathetic.
You are always welcome to go away, and take your pathetic waste-of-space trolling with you.
This site is so cute. Tony makes stupid and you folks suck his whine.
Poor little More Git the moron.
He has zero to offer in life.
Wow! A lot happened while I was away.
I appreciate Colorado Wellington linking to old posts. It helps to know “Martin Smith” has an MO.
I still believe it is best to approach a troll you don’t know or are not familiar with “as if” they were merely misinformed. Be polite but be informative. Only after they have proven themselves guilty of obstinate obfuscation should the slings and arrows of sarcasm begin.
When I checked back to an old post I saw Colorado Wellington did exactly that. He began with a kindly explanation, and then watched to see how it was received.
It was interesting, and a bit pitiful, how Martin Smith clung to the trend graph, which was apparently what he considered “a knock out punch”. You can point out it begins in 1979 when the ice was at a high point, and ends in 2012 when ice was at a low point (and hasn’t been updated), but it doesn’t penetrate. He is like a horse that can’t see outside its blinders, I suppose. When he brought up the trend graphs, especially the animated one “How Skeptics view sea-ice decline”, he was bringing out his big guns. When everyone yawned and had ready answers, he must have felt like a five-year-old taking a swing at a father. (Time to beat a hasty retreat, or attempt to adroitly change the subject and then, when others yawn and have ready answers regarding the new subject, to accuse others of changing the subject, claim the moral high ground, and only then beat the hasty retreat.)
I confess there are certain trolls I no longer reply to, even when they directly address me. After a certain point being polite and informative to some individuals is tantamount to throwing pearls to swine. However, when possible, I think it is best to continue to pop valid information into ones reply. Some trolls deserve mud-slinging, for that (and not pearls) is what pigs understand, but to descend completely to that mud-slinging level is forgetful of the fact there may be some lurking onlookers, who are misinformed, but curious about what the Truth actually is. When possible, pepper sarcasm with facts, for that pepper stings like salt, to the troll, but also enlightens the lurker.
Caleb,
I agree with the general principle you’ve outlined. I grew up in a tough part of town and I took part in a few “robust discussions” back in the day. I can take it but I much prefer that we lower the pitch and settle our differences politely. The one thing I don’t have much patience for is sneaky slander and deceit poorly camouflaged by phony politeness. I’ve seen enough of that in the academia to know it’s common but I never stopped hating it.
Martin Smith started showing his style early but I still offered him an opportunity to make his case and, possibly, withdraw his more outlandish charges. I thought that maybe he was just sloppy in his language and would realize that. He declined to respond several times and just kept repeating the same accusations, claiming he didn’t understand my questions. I stopped believing him. I thought he knew exactly what he was doing. He was behaving like a typical troll: Misrepresenting others’ words, building strawmen, answering specific questions with generalities, faking not understanding, ignoring challenges and simply repeating the same claims to wear people down, and ultimately departing without a response.
His modus operandi is well recognizable in another thread. Here he accused Steven Goddard of dishonesty for posting a static, saved copy of a DMI graph. Never mind that Steven always archives a copy and posts the same link to the DMI page where the current graph came from. He claimed Steven purposely posts a “doctored” copy of the “wrong graph”. Never mind that the subject of masking out the coastal areas was discussed before and can be found. Never mind that other commenters were trying to explain it to him. Martin Smith insisted that Goddard is duping them because his archived copies don’t display a comment outside the actual graph.
Here is this dishonest troll in his own words:
“Steven, you are still using the wrong graph. By now you know that the wrong graph is deceptive. This is the correct graph.”
—
“The Danish Meteorological Institute says this is the correct graph and the one Steven doctored and then posted is incorrect.”
—
“Read the comment at the bottom of the correct graph. Then follow the link to the graph Steven used, and read the comment at the bottom of that graph, which Steven removed.
—
“Steven used the wrong graph, and he doctored it. …”
—
“Oh, come on. If you use the link to the graph Steven used, instead of the doctored copy he posted, …”
—
“Steven doctored it by removing the qualifying comment at the bottom, written by DMI …”
—
After repeating the “doctoring” claim, by my count, some 11 times he departed with these words:
“Well, once again, we are repeating ourselves, so let’s end this. Move on.”
He richly deserves the abuse and ridicule heaped on him. This post is peppered with facts about Martin Smith but I may get back to some simple mockery again. 🙂
You’re right Colorado ; it stunk of a Troll set-up. SG had it right at 12.54pm – that he can’t possibly be as stupid & illiterate… ( only if he pretended ).
If on purpose.. its very useless and ineffective.
Occam says to put it down to basic ignorance and incompetence.
I think he really is that dumb.
Sad but true, and an excellent summery.
Now that his MO is so clearly defined, Martin Smith will likely have to change the name he posts under, when he visits.
One redeeming thing about this sort of annoying visitor is that they give you a sort of heads-up, and alert you to the talking-points used in Alarmist echo chambers. Not that they have have come up with much that is new, lately. 🙂
Martin Smith and Mogur2013 are part of the 97% consensus that say earth’s oceans will boil, all the coral will be eaten by acid, sea levels will submerge Florida, there will be a tipping point where runaway greenhouse effect will turn Earth into Venus, poison ivy will be more severe, polar bears will forget how to swim, etc. Here is a chart listing the stupidest people on earth:
Moron: IQ 60-80
Imbecile: IQ 30-60
Idiot: IQ 0-30
Alarmist: IQ below 0
Imbecile sounds like the dumbest though.
Martin is a time wasting troll.
I think he actually has no specific knowledge.
He does not even know how to post actual graphs…only links.
He is not smart or informed enough to even understand our criticisms, let alone realize how little he himself knows.
I pity him…his is a dark world, full of the certainty of impending doom.
http://realclimatescience.com/wp-content/uploads/2015/11/2015-11-08-04-27-31.png
You know…I’m going to post this plot once again because…well, because it is such a beautiful plot. 🙂 So full of truth and insight. A marvel, really. In fact, it has inspired a poem…
—
Oh sea ice plot from DMI
Would you please tell me why
There are some who aren’t OK
With the cold, hard truth that you display
That multiyear ice at nature’s pole
Is there for everyone to extol
Except for those who choose to ignore
And would rather believe in ol’ Al Gore
—
😉
Obviously the current state trend of ice extent at both Poles INCREASING year after year is really very very worrying to the AGW fraudsters. See Cryosphere today “an alarmist” if anything site but more controlled
The informed alarmists who have taken public funding and returned only lies have every reason to be pooping their britches.
And as of today, 11/11/15. It’s still climbing like crazy
http://ocean.dmi.dk/arctic/plots/icecover/icecover_current.png
Once again it posts an old plot. Here’s the link to the current one:
http://ocean.dmi.dk/arctic/old_icecover.uk.php
http://ocean.dmi.dk/arctic/old_icecover.uk.php?foo=baz
Just a test, I added ?foo=baz at the end
http://ocean.dmi.dk/arctic/plots/icecover/icecover_current.png
Interesting. What sort of black art is this? 😉
I suspected that wordpress cached these images based on URL so that if the URL were changed, that wordpress might be fooled and grab a fresh one. But if you added that to the end, unfortunately it still seems to be the stale image. And I admit I don’t know how to insert images in these comments, or I would have tested myself.
Testing
Neal to put in images, put the URL with a gif, jpg, or png ending on a separate line from the rest of the text. I usually leave a space above and below. (Easier to poof reed)
Gail Combs says:
(Easier to poof reed)
LOL! 😉
http://ocean.DMI.dk/arctic/plots/icecover/icecover_current.png
I uppercased the DMI in first part of URL
Congratulations!
Since the first portion of the URL is case insensitive (but the rest might not be) I suspected that changing the case in the first portion would allow accessing the right image on the remote host, while defeating wordpresses attempt at caching the image.
I suspected, but did not want to test, that putting the ?foo=baz at end would prevent wordpress from realizing it was actually an image … but I guess I will test that here
http://ocean.dmi.dk/arctic/plots/icecover/icecover_current.png?foo=baz