
Admiral Titley can’t see the pause.
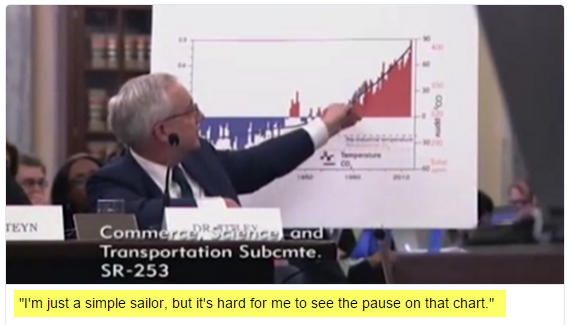
He can’t see the pause, because NOAA criminals just made it disappear.
Then he went on to imply that taking Earth’s temperature was simple, sort of like sticking a rectal thermometer in. He forgot to mention that half of the NOAA data is fake.

He also forgot to mention that satellites and balloons show the pause unequivocally.
I give him top prize for climate fraudster of the day.

What did the president of the plumbers & pipefitters union have to say?
I watched the whole thing live today, and I have to say that he pissed me off the most.
Oh! Yes! I did see your chart right next to this one.
https://www.ncdc.noaa.gov/img/climate/research/ushcn/ts.ushcn_anom25_diffs_urb-raw_pg.gif
What worries me is that he represents what is left of a military once dedicated to defending this country, but now focussed on “greening” the world with biofuel experimentation, solar energy experiments and wind farm foolishness.
Our embassy guards are often without arms and Admiral Titley drags out a NCA chart showing cooling for over 1/3 of the time period covered while CO2 rises. Of course, the last 20 years are “doctored” by “Doctors” undeserving of their titles, and Titley parrots “warmest ever” inconveniently forgetting the error bars.
Pathetic and sad for our Nation, declining into mediocrity under a CO2 crazed administration .
I agree with your assessment of the sad state of our nation.
However, both sides in the Senate Hearing on AGW – Data or Dogma simply ignored this empirical fact: The Sun is the Creator & Sustainer of every atom, life and planet in the solar system !
(I will not post the link to empirical evidence out of respect for our host.)
After watching the entire debate, I am now convinced the AGW debate cannot be won if AGW doubters accept the false premise of AGW believers: The Sun is NOT the Creator & Sustainer of every atom, life and planet in the solar system !
Climatology itself has too much uncertainty and too few issues to be settled with yes/no answers. E.g.,
_ a.) Does interstellar hydrogen collapse into stars, or
_ b.) Do stars make and discard hydrogen to interstellar space?
I agree, Steve C. Most annoying was that his appearance was so fatherly, so honest seeming with such a calm and rational tone to his voice, yet every sentence out of his mouth was a blatant untruth. I could scarcely believe that with his credentials he could be so oblivious to obvious scientific truths. He managed to cover all the AGW nonsense of the oceans heating and rising to flood the lands, hottest years, acidification of our alkaline! oceans, Hurricane Sandy, no less (I think that was him.), etc. I didn’t take notes. Worst of all. I think, was the constant repetition of the 97% number which has been debunked several times. The Dem. Senators aided and abetted.
I was reminded of the quote, ” Nothing is more frightening than ignorance in action.”. I’m away from home, listened in my parked car, middle of my trip, so can’t remind myself about who said it: Feynman, Goethe??
Hey Barbara! Good quote! I looked it up — Goethe!
I was reminded of another quote, one from Upton Sinclair, that you have probably seen. “It is difficult to get a man to understand something, when his salary depends upon his not understanding it!”
He also forgot to mention that .04%
Titley’s Navy Bio:
http://www.navy.mil/navydata/bios/navybio.asp?bioID=438
from whence he went to NOAA
http://www.noaa.gov/titley.html
likely double dipping in his Navy pension and NOAA administrator salary. I wonder how much of his pay comes from Exxon and the Koch bros. enormous tax liabilities?
NOAA says “Dr. Titley’s career included duties as Oceanographer and Navigator of the Navy; director, Task Force Climate Change; and Assistant Chief of Naval Operations for Information Dominance.”
Task Force Climate Change ?????
Information Dominanace ????
Is he paid to lie?
How come there’s no pause in the oceans? The planet has clearly been warming up all the time…
Since 2001, the ocean trend in UAH is -0.001C/year. ie PLATEAU !
Surely even you aren’t falling for Tom Karl’s massive farce of adjustments of real ocean temperatures.
Where will you run and hide after the current El Nino finished early next year, little child. !! 😉
Andy, do you at least understand that your entire argument rests only on your belief that ALL the scientists who publish papers that validate AGW are lying?
Post the link to one paper that proves that CO2 causes warming in an open atmosphere.
Andy, you can’t be serious. Please answer my question honestly: Do you at least understand that your entire argument rests only on your belief that ALL the scientists who publish papers that validate AGW are lying?
I knew you would run away from actually providing something to support your rhetoric.
Again, you say that all these scientists support AGW,, should be a doddle for you to produce a paper that actually proves that CO2 causes warming in an open atmosphere..
Can you ? .. or will you keep running away.
Come on Martin……..
where’s all the papers that actually prove the very basis of the AGW farce….
Surely you must be able to find one….
Not one that assumes it because of grant funding……. one that proves it.
If they all rely on supporting the same hypothesis to gain funding then it is more probable than possible.
No Martin, Andy’s point in this thread rests on his belief that ONLY TOM KARL’S REANALYSIS is a lie. Your argument rests on your belief that ALL THE OTHER SCIENTISTS are lying.
Try to keep up. IPCC5 has a rather substantial section covering the “pause.” That was the consensus a mere 7 months ago. Karl is the one telling the rest of the climate science community they’re wrong, not Andy.
No it’s not. Ocean surface temperature is not the same thing as temperature of the ocean (water column). This is elementary.
Next year will be the warmest in history and the faux hiatus will be just an embarrassing memory.
I don’t know whether 2016 will be the warmest year in history, the people in charge of data tampering have not voted on it yet. But we can be sure 2017 won’t be, because all the climate scientists will be looking for jobs after inauguration day.
Cfgjd: I am just curious how you can say “next year will be the warmest in history?” History is but a blink of the eye – maybe 200 years of recordings. What about all those years that mankind did not have the technology to do any recordings (isn’t the world supposed to be about 4.5 billion years old). Surely there were years, months and days that were warmer than the “current warmest ever.”
All I can see here from you and Martin, you both lack common sense, throw out big words that you copy and paste from a list that you have made and think that you are voices of authority. Both of you just blather from both sides of your mouths and have nothing to really offer.
In other words, both of you are passing in the wind and are enjoying your yellow showers!
It’s all in the adjustments Peter. If not CF would not be able to make any sort of prediction on global weather.
“Next year will be the warmest in history”
Sent the memorandum to Gavin and Tom, have you.
Telling them to make sure they adjust and fabricate enough data.
An instruction to further fraud.
How does CO2 warm the ocean, genius?
I think I read somewhere that Cjgjd believes there is a girl CO2 molecule and a boy CO2 molecule and that when they meet, they rub together and produce heat. Therefore the oceans are warming.
<b.There IS a pause in the ocean temperatures.
This is a graph from the EPA.
The ocean temperatures plateaued in 1998 and even dropped a bit at the end starting in 2010.
http://www3.epa.gov/climatechange/images/indicator_figures/sea-surface-temp-figure1-2013.gif
What if you start at 2000 instead of 1998? Is there a reason you chose to start at 1998?
No-one is starting in 1998. You seriously are DUMB, aren’t you !!!
Its your understanding of the principles behind the calculation of the plateau really that poor ?
Andy, are you afraid to let Steven answer the question? The Y axis of the graph begins in 1998. If you want to say 1997, I don’t care. The questions for Steven are: Why did you choose to start the Y axis at 1998? What happens if you start the Y-axis 2 years later? Let Steven answer. He’s a big boy.
“The Y axis of the graph begins in 1998”
You are hallucinating. !!!
You have just admitted by your fancy side-sliming , that you have no idea of the principles behind the calculation of the length of the plateau.
Well done. 🙂 Yet another display of our wanton ignorance.
darn typo !!
Yet another display of YOUR wanton ignorance.
Come on Martin, explain how the “plateau” length is calculated.
Show that you have more than a junior high level arts level intelligence.
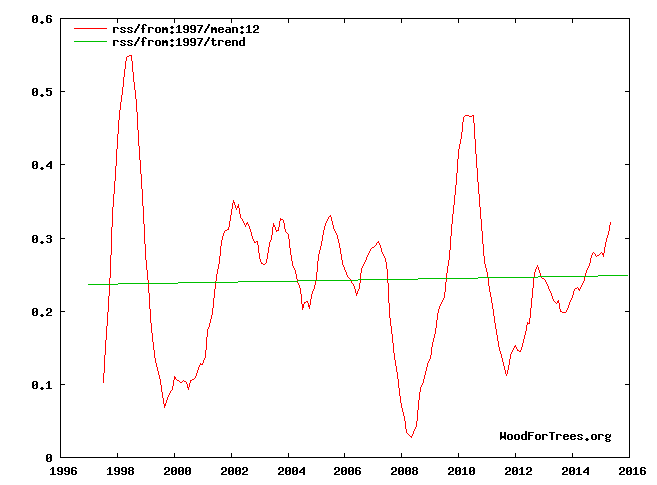
Steven, there is no plateau calculation involved. One chooses a time interval and then computes a simple linear regression trend line for all the data in the selected interval. It makes a big difference where you choose you start year. Steven, it really is shocking you don’t understand these simple mathematical concepts.
No, Smith, if anything, people are afraid you may be sneaking around his place in disguise. Your obsession is unhealthy. Get help.
So, no idea whatsoever.. As was obvious from the start.
You have just shown to everyone that you are a mathematical midget with absolutely ZERO COMPREHENSION on how the plateau is calculated.. 🙂
This is getting quite funny watching you tie yourself in knots of your own ignorance 🙂
I’ll give you a hint, little mathematic inebriate…
The starting point is mathematically determined.
Now let’s see your junior high arts prowess in working out the rest.
This is hilarious.. 🙂 Thanks for providing such comedy little goreboy. 🙂
Martin, the y axis starts at 0. If the x axis and y axis both start at 1998 there will be no plot at all.
We all all laughing at you because you failed the first pop quiz in 7th grade geometry when they explained cartesian coordinates. Nobody here takes you for anything but a stupid fool, good for nothing but a laugh.
Martin-
Now you’re just outright lying, you stupid mother f***er. Tony has REPEATEDLY published graphs with a year 2000 start point. Here’s just the first hit from a search of “no warming since 2000”
https://stevengoddard.wordpress.com/2013/08/12/un-announces-that-0-00c-warming-since-the-year-2000-is-unprecedented/
I remember one post in particular where either you or cfjgd accused Tony of cherry picking BECAUSE he started in 2000.
I’ve tried to be civil with you. I’ve begged you many times for a rational debate. To this point, you’ve ignored every plea for reason. I’ll try it one last time. Give us your best evidence that the satellite measurements are wrong. No conjecture, no appeal to authority. Show us the peer reviewed study proving that those satellites have experienced a continuous buildup of errors, almost exactly matching both the chronology and the magnitude of Tom Karl’s recent set of adjustments, but in the opposite direction. Show us why we should believe that, pre Karl, both the satellites and the thermometers began diverging from reality by roughly the same amount, at the exact same time, but for entirely unrelated reasons. Show us why we should believe Karl, instead of the entire rest of the world.
Put up or shut up, you lying bastard.
Here is the pause that never existed according to Marty the Troll and the CFool. Note the first date the ClimAstrologists did not notice the lack of warming / pause. Then go down the list through to 2015.
H/T Jimbo
Dr. Phil Jones – CRU emails – 5th July, 2005
“The scientific community would come down on me in no uncertain terms if I said the world had cooled from 1998. OK it has but it is only 7 years of data and it isn’t statistically significant….”
Dr. Phil Jones – CRU emails – 7th May, 2009
‘Bottom line: the ‘no upward trend’ has to continue for a total of 15 years before we get worried.’
__________________
Dr. Judith L. Lean – Geophysical Research Letters – 15 Aug 2009
“…This lack of overall warming is analogous to the period from 2002 to 2008 when decreasing solar irradiance also countered much of the anthropogenic warming…”
__________________
Dr. Kevin Trenberth – CRU emails – 12 Oct. 2009
“Well, I have my own article on where the heck is global warming…..The fact is that we can’t account for the lack of warming at the moment and it is a travesty that we can’t.”
__________________
Dr. Mojib Latif – Spiegel – 19th November 2009
“At present, however, the warming is taking a break,”…….”There can be no argument about that,”
__________________
Dr. Jochem Marotzke – Spiegel – 19th November 2009
“It cannot be denied that this is one of the hottest issues in the scientific community,”….”We don’t really know why this stagnation is taking place at this point.”
__________________
Dr. Phil Jones – BBC – 13th February 2010
“I’m a scientist trying to measure temperature. If I registered that the climate has been cooling I’d say so. But it hasn’t until recently – and then barely at all. The trend is a warming trend.”
__________________
Dr. Phil Jones – BBC – 13th February 2010
[Q] B – “Do you agree that from 1995 to the present there has been no statistically-significant global warming”
[A] “Yes, but only just”.
__________________
Prof. Shaowu Wang et al – Advances in Climate Change Research – 2010
“…The decade of 1999-2008 is still the warmest of the last 30 years, though the global temperature increment is near zero;…”
__________________
Dr. B. G. Hunt – Climate Dynamics – February 2011
“Controversy continues to prevail concerning the reality of anthropogenically-induced climatic warming. One of the principal issues is the cause of the hiatus in the current global warming trend.”
__________________
Dr. Robert K. Kaufmann – PNAS – 2nd June 2011
“…..it has been unclear why global surface temperatures did not rise between 1998 and 2008…..”
__________________
Dr. Gerald A. Meehl – Nature Climate Change – 18th September 2011
“There have been decades, such as 2000–2009, when the observed globally averaged surface-temperature time series shows little increase or even a slightly negative trend1 (a hiatus period)….”
__________________
Met Office Blog – Dave Britton (10:48:21) – 14 October 2012
“We agree with Mr Rose that there has been only a very small amount of warming in the 21st Century. As stated in our response, this is 0.05 degrees Celsius since 1997 equivalent to 0.03 degrees Celsius per decade.”
Source: metofficenews.wordpress.com/2012/10/14/met-office-in-the-media-14-october-2012
__________________
Dr. James Hansen – NASA GISS – 15 January 2013
“The 5-year mean global temperature has been flat for a decade, which we interpret as a combination of natural variability and a slowdown in the growth rate of the net climate forcing.”
__________________
Dr Doug Smith – Met Office – 18 January 2013
“The exact causes of the temperature standstill are not yet understood,” says climate researcher Doug Smith from the Met Office.
[Translated by Philipp Mueller from Spiegel Online]
__________________
Dr. Virginie Guemas – Nature Climate Change – 7 April 2013
“…Despite a sustained production of anthropogenic greenhouse gases, the Earth’s mean near-surface temperature paused its rise during the 2000–2010 period…”
__________________
Dr. Judith Curry – House of Representatives Subcommittee on Environment – 25 April 2013
” If the climate shifts hypothesis is correct, then the current flat trend in global surface temperatures may continue for another decade or two,…”
__________________
Dr. Hans von Storch – Spiegel – 20 June 2013
“…the increase over the last 15 years was just 0.06 degrees Celsius (0.11 degrees Fahrenheit) — a value very close to zero….If things continue as they have been, in five years, at the latest, we will need to acknowledge that something is fundamentally wrong with our climate models….”
__________________
Professor Masahiro Watanabe – Geophysical Research Letters – 28 June 2013
“The weakening of k commonly found in GCMs seems to be an inevitable response of the climate system to global warming, suggesting the recovery from hiatus in coming decades.”
__________________
Met Office – July 2013
“The recent pause in global warming, part 3: What are the implications for projections of future warming?
………..
Executive summary
The recent pause in global surface temperature rise does not materially alter the risks of substantial warming of the Earth by the end of this century.”
Source: metoffice.gov.uk/media/pdf/3/r/Paper3_Implications_for_projections.pdf
__________________
Professor Rowan Sutton – Independent – 22 July 2013
“Some people call it a slow-down, some call it a hiatus, some people call it a pause. The global average surface temperature has not increased substantially over the last 10 to 15 years,”
__________________
Dr. Kevin Trenberth – NPR – 23 August 2013
“They probably can’t go on much for much longer than maybe 20 years, and what happens at the end of these hiatus periods, is suddenly there’s a big jump [in temperature] up to a whole new level and you never go back to that previous level again,”
__________________
Dr. Yu Kosaka et. al. – Nature – 28 August 2013
“Recent global-warming hiatus tied to equatorial Pacific surface cooling
Despite the continued increase in atmospheric greenhouse gas concentrations, the annual-mean global temperature has not risen in the twenty-first century…”
__________________
Professor Anastasios Tsonis – Daily Telegraph – 8 September 2013
“We are already in a cooling trend, which I think will continue for the next 15 years at least. There is no doubt the warming of the 1980s and 1990s has stopped.”
__________________
Dr. Kevin E. Trenberth – Nature News Feature – 15 January 2014
“The 1997 to ’98 El Niño event was a trigger for the changes in the Pacific, and I think that’s very probably the beginning of the hiatus,” says Kevin Trenberth, a climate scientist…
__________________
Dr. Gabriel Vecchi – Nature News Feature – 15 January 2014
“A few years ago you saw the hiatus, but it could be dismissed because it was well within the noise,” says Gabriel Vecchi, a climate scientist…“Now it’s something to explain.”…..
__________________
Professor Matthew England – ABC Science – 10 February 2014
“Even though there is this hiatus in this surface average temperature, we’re still getting record heat waves, we’re still getting harsh bush fires…..it shows we shouldn’t take any comfort from this plateau in global average temperatures.”
__________________
Dr. Jana Sillmann et al – IopScience – 18 June 2014
Observed and simulated temperature extremes during the recent warming hiatus
“This regional inconsistency between models and observations might be a key to understanding the recent hiatus in global mean temperature warming.”
__________________
Dr. Young-Heon Jo et al – American Meteorological Society – October 2014
“…..Furthermore, the low-frequency variability in the SPG relates to the propagation of Atlantic meridional overturning circulation (AMOC) variations from the deep-water formation region to mid-latitudes in the North Atlantic, which might have the implications for recent global surface warming hiatus.”
__________________
Dr. Hans Gleisner – Geophysical Research Letters – 2015
Recent global warming hiatus dominated by low latitude temperature trends in surface and troposphere data
Over the last 15 years, global mean surface temperatures exhibit only weak trends…..Omission of successively larger polar regions from the global-mean temperature calculations, in both tropospheric and surface data sets, shows that data gaps at high latitudes can not explain the observed differences between the hiatus and the pre-hiatus period….
http://onlinelibrary.wiley.com/doi/10.1002/2014GL062596/abstract
__________________
==
Shuai-Lei Yao et al – Theoretical and Applied Climatology – 9 January 2015
The global warming hiatus—a natural product of interactions of a secular warming trend and a multi-decadal oscillation
….We provide compelling evidence that the global warming hiatus is a natural product of the interplays between a secular warming tendency…..
http://link.springer.com/article/10.1007/s00704-014-1358-x
__________________
H. Douville et al – 2015
The recent global-warming hiatus: What is the role of Pacific variability?
The observed global mean surface air temperature (GMST) has not risen over the last 15 years, spurring outbreaks of skepticism regarding the nature of global warming and challenging the upper-range transient response of the current-generation global climate models….
http://onlinelibrary.wiley.com/doi/10.1002/2014GL062775/abstract
__________________
Dr. Kevin E. Trenberth 11 July 2014
Seasonal aspects of the recent pause in surface warming
Factors involved in the recent pause in the rise of global mean temperatures are examined seasonally. For 1999 to 2012, the hiatus in surface warming is mainly evident in the central and eastern Pacific…….atmospheric circulation anomalies observed globally during the hiatus.
http://www.nature.com/nclimate/journal/v4/n10/full/nclimate2341.html
SIGHHhhhh,
I have explained this multiple times.
The ClimAstrologists gave varying time periods as falsification criteria for CAGW. So to determine if those falsification criterias are met you start in the present and go back in time until the slope becomes positive. At that point The Goose is Cooked.
>>>>>>>>>>>>>>>>>>>>>>>>>>>
<b.The original statements made by Warmists:
1. Prof. Phil Jones saying in the Climategate emails – “Bottom line: the “no upward trend” has to continue for a total of 15 years before we get worried.” Also see: interview with Judith Curry and Phil Jones
2. Ben Santer in a 2011 paper “Our results show that temperature records of at least 17 years in length are required for identifying human effects on global-mean tropospheric temperature.” link
3. The NOAA falsification criterion is on page S23 of its 2008 report titled The State Of The Climate
4. we are looking at no changes in temperature over a period longer than the 10 years that James Hansen once said would show the models wrong;
____
More recent statements:
Dr. Hans von Storch – Spiegel – 20 June 2013
“…the increase over the last 15 years was just 0.06 degrees Celsius (0.11 degrees Fahrenheit) — a value very close to zero….If things continue as they have been, in five years, at the latest, we will need to acknowledge that something is fundamentally wrong with our climate models….”
Dr. Gabriel Vecchi – Nature News Feature – 15 January 2014
“A few years ago you saw the hiatus, but it could be dismissed because it was well within the noise,” says Gabriel Vecchi, a climate scientist…“Now it’s something to explain.”…..
>>>>>>>>>>>>>>>>>>>>>>>>>>>>
Thus the falsification criteria is 15 years to 17 years. Once we hit 17 years (a year ago) The Goose was Cooked. Unfortunately the Goose seems to be a zombie and keeps rising from the dead. Anyone have silver bullets, garlic and a wooden stake?
Martin, do you agree that recent NOAA figures have been “adjusted” to eliminate the pause?
If so, how do you justify that?
QV, no, there was no pause to begin with. You are calling all of these pauses: http://www.skepticalscience.com/graphics.php?g=47
Obviously, none of them was a pause. The NOAA data is adjusted to make it more correct. If you or Steven have any evidence that the adjustment is incorrect, post the evidence. Steven has never posted any evidence that this adjustment, or any other adjustment, is incorrect. Showing the effect of the adjustment is not evidence that the adjustment is incorrect, and it is certainly not evidence of fraud. You have to show that the adjustment is wrong. Please do that, if you can. And if you can, you will be famous.
And you have never posted anything that shows it is correct…..
because you know its all a load of agenda driven fraud.
And seriously , still linking to the comic site that s SkS..
no science there… but again.. you know that.. you are just mouthing empty garbage as usual.
Steven, the science that shows the adjustment is correct is available from GISS. You are welcome to read it there.
No.
Because the original data has been changed, you and NOAA have to show that the they were incorrect and the new data are correct.
Otherwise, all data is worthless and can be adjusted ad infinitum, to prove whatever they want.
QV,
The numbers (no longer data) HAVE been adjusted ad infinitum…
…. and its keeps getting adjusted, which proves it is ALWAYS wrong.
Martin and especially GISS will also needs to prove that the fabricated pal-reviewed adjustment routines have actually been applied correctly.
That’s going to be fun to watch if a solid Republican gets in as US president next election. 🙂
Martin-
“QV, no, there was no pause to begin with. ”
Why are you calling the latest IPCC report fraudulent? Do you have any evidence to back up your claim that they’re lying?
http://www.ipcc.ch/pdf/assessment-report/ar5/wg1/WG1AR5_Chapter09_FINAL.pdf
Starting on page 769, you’ll see a long section about the, “much smaller increasing linear trend over the last 15 years…”
You should be careful. Michael Mann has a history of suing people for such accusations.
You should look at the climate in multiples of
Schwabe cycles (11 year)
Hale – Nicholson (22 yrs)
Gleissberg (87 years)
De Vries (210 years)
These are things that were not discussed at the hearing, but this is crucial to understanding climate change.
http://virtualacademia.com/pdf/cli267_293.pdf
Note tables II and III which strongly support the 87 year cycle observable from the sun’s temp. effected on earth [that which is coming through the atmosphere]
Steven, you are again showing the post-adjustment data juxtaposed with the pre-adjustment data, and you are calling the post-adjustment data fraudulent simply and only because the adjusted data is different from the unadjusted data. That isn’t fraud. It isn’t even incorrect, unless you have some evidence that the adjustment is incorrect. Do you? Why not post that evidence?
Martin, you are again posting meaningless crap.
But its all you have.
One example.. Reykjavik.
Prove that the massive GISS adjustment is justified, even when the guys who look after the data in Iceland say the adjustments are a LOAD of CRAP.
Everything has been adjusted with one aim.. and that is to support to failed hypothesis of AGW..
Its is FRAUD. ! End of story.
I recall the Icelanders who collected the data were pretty pissed when they saw the “adjustments” to their original measurements done by our superior experts.
Notice how Martin hasn’t responded on this yet.. He knows he has nothing.
Steven, what you recall doesn’t matter. It’s what you can prove that counts. You keep claiming fraud, but you never post any evidence of fraud.
A nitwit tells the Icelanders:
Prove to me that our adjustments of your measured temperature record are incorrect!
And when he does he has, as usual .. ABSOLUTELY NOTHING
Just empty, gutless mouthing..
Deliberate adjustments to meet an agenda.. IS FRAUD…… end of story !!
I’ll call you all Steven from now on, since you presume to answer for him anyway.
Steven, GISS justifies each adjustment; the science is peer-reviewed, and the data, methods, and justification are published. You are welcome to get that information from GISS and replicate the work, if you wish. But, if you and Steven wish instead to claim the science is wrong, you have to prove that.
GISS DOES NOT justify any specific adjustment.
They cover it all with empty blather.. just like you do. !
SG has got the information from GISS and GHCN..
He has shown that most of their adjustments are totally unjustified, and made purely to further an agenda.. That is FRAUD.
And those guys better hope like heck that a Democrat steal the next US election, because otherwise they are in for a world of hurt as the data mal-adjustments are exposed .
I hope you are happy to have you name recorded on blogs as supporting this fraud 😉
AndyG55 says:December 9, 2015 at 11:06 am
And those guys better hope like heck that a Democrat steal the next US election, because otherwise they are in for a world of hurt as the data mal-adjustments are exposed .
A Republican administration isn’t necessarily a ticket to climate sanity.
The right Republican might be. But I do know what you mean.
Martin-
Tony doesn’t comment much here. He never has. But he recently made a special exception, just for you. He attempted to engage you in conversation, to an extent that I’ve never seen him do before. Your only response was to complain about his formatting choice. So no, I don’t see much reason you should expect him to repeatedly answer your endlessly repetitive questions. He’s given you answers. You’ve ignored them. If you want new answers, try asking new questions.
As to the adjustments, the burden of proof lies with the one claiming that the measurements were incorrect. Until that burden of proof is met, all adjustments are fraudulent by default. So I ask you yet again to point us to the mathematical and scientific justifications for the adjustments that have been made. Without a fully open process, reviewable by friend and foe alike, there can be no science. Tell us why YOU believe the adjustments ate correct.
Martin Smith demands that Steven Goddard answers to him or he will punish everyone by saying “Steven” to them! Run before he says “Steven” again! Appease him! Get shrubbery!
https://www.youtube.com/watch?v=QTQfGd3G6dg
How come there’s still no proof of fraudulent adjustments? Why isn’t someone paying the skeptics to stud this issue? Oh wait, perhaps the whole issue is just a RED HERRING that would disappear if studied…
All data adjustments are fraud by definition.
Looks like you have not measured much of anything lately, and especially not with satellites or anything more complicated than a slide ruler.
Please note that the readings of most temperature-sensors are in units of current or voltage. Obviously we must adjust or go home.
I have never measured anything with a slide ruler, you idiot.
“Please note that the readings of most temperature-sensors are in units of current or voltage. Obviously we must adjust or go home.”
Very logical. Thermometers in 1930 read out in voltage, so we need to adjust the voltage 85 years later.
“Please note that the readings of mercury thermometers are only changes in mercury volume. Obviously we must adjust or go home.”
Veteran journalist Günter Ederer* writes a piece reporting that massive alterations have been found in the NASA GISS temperature data series, citing a comprehensive analysis conducted by a leading German scientist. These results are now available to the public.
Ederer reports not long ago retired geologist and data computation expert Professor Dr. Friedrich Karl Ewert began looking at the data behind the global warming claims, and especially the datasets of NASA’s Goddard Institute of Space Studies (GISS).
Ewert painstakingly examined and tabulated the reams of archived data from 1153 stations that go back to 1881 – which NASA has publicly available – data that the UN IPCC uses to base its conclusion that man is heating the Earth’s atmosphere through the burning of fossil fuels. According to Ederer, what Professor Ewert found is “unbelievable”:
From the publicly available data, Ewert made an unbelievable discovery: Between the years 2010 and 2012 the data measured since 1881 were altered so that they showed a significant warming, especially after 1950. […] A comparison of the data from 2010 with the data of 2012 shows that NASA-GISS had altered its own datasets so that especially after WWII a clear warming appears – although it never existed.”
Ederer writes that Ewert particularly found alterations at stations in the Arctic. Professor Ewert randomly selected 120 stations from all over the world and compared the 2010 archived data to the 2012 data and found that they had been tampered to produce warming.
The old data showed regular cycles of warming and cooling over the period, even as atmospheric CO2 concentration rose from 0.03% to 0.04%. According to the original NASA datasets, Ederer writes, the mean global temperature cooled from 13.8°C in 1881 to 12.9°C in 1895. Then it rose to 14.3°C by 1905 and fell back under 12.9°C by 1920, rose to 13.9°C by 1930, fell to 13° by 1975 before rising to 14°C by 2000. By 2010 the temperature fell back to 13.2°C.
But then came the “massive” altering of data, which also altered the entire overall trend for the period. According to journalist Ederer, Ewert uncovered 10 different methods NASA used to alter the data. The 6 most often used methods were:
• Reducing the annual mean in the early phase.
• Reducing the high values in the first warming phase.
• Increasing individual values during the second warming phase.
• Suppression of the second cooling phase starting in 1995.
• Shortening the early decades of the datasets.
• With the long-term datasets, even the first century was shortened.
The methods were employed for stations such as Darwin, Australia and Palma de Mallorca, for example, where cooling trends were suddenly transformed into warming.
Ewert then discovered that NASA having altered the datasets once in March 2012 was not enough. Alterations were made again in August 2012, and yet again in December 2012. For Palma de Majorca: “Now because of the new datasets it has gotten even warmer. Now they show a warming of +0.01202°C per year.”
The veteran German journalist Ederer writes that the media reports of ongoing global warming are in fact not based on reality at all, but rather on “the constantly altered temperatures of the earlier decades.” Ederer adds:
Thus the issue of man-made global warming has taken on a whole new meaning: Yes, it is always man-made if the data are adjusted to fit the theory. The meticulous work by Ewert has predecessors, and fits a series of scandals and contradictions that are simply being ignored by the political supporters of man-made climate change.”
Ederer also brings up the analysis by American meteorologists Joseph D’Aleo and Anthony Watts who examined 6000 NASA measurement stations and found an abundance of measurement irregularities stemming in large part from serious siting issues. According to Ederer the findings by Professor Ewert are in close agreement with those of Watts and D’Aleo.
Ederer writes of the overall findings by Professor Ewert:
Using the NASA data from 2010 the surface temperature globally from 1940 until today has fallen by 1.110°C, and since 2000 it has fallen 0.4223°C […]. The cooling has hit every continent except for Australia, which warmed by 0.6339°C since 2000. The figures for Europe: From 1940 to 2010, using the data from 2010, there was a cooling of 0.5465°C and a cooling of 0.3739°C since 2000.”
Ederer summarizes that in view of the magnitude of the scandal, one would think that there would be in investigation. Yet he does not believe this will be the case because the global warming has turned into a trillion-dollar industry and that that too much is tied to it.
All datasets are available to the public at any time. The studies by Prof. Ewert may be requested by e-mail: [email protected].
http://notrickszone.com/2015/11/20/german-professor-examines-nasa-giss-temperature-datasets-finds-they-have-been-massively-altered/
And then there is Reykjavik, and the Iceland Met Office, who says that GISS adjustments are incorrect.
Now it is time for you to show us how and why all these adjustments are repeatedly made ad nauseum, and explain why the adjusters ignore reality and the requests for their all of their data and methods.
It is the duty of Prof. Ewert to submit his study to a peer-reviewed Journal. There are even open access open review ones, so no reason to not submit, except non-confidence in the quality of one’s own work..
“I can’t see either of these papers being in the next IPCC report. Kevin and I will keep them out somehow — even if we have to redefine what the peer-review literature is!”
-Phil Jones
The Iceland Met Office says the adjustments to their data are falsehoods. Please explain.
Science does not require journal peer review. Newton was able to discern laws of nature with zero science journals.
Now it is time for you to show us how and why all these adjustments are repeatedly made ad nauseum, and explain why the adjusters ignore reality and the requests for their all of their data and methods.
If you were in any way a peer of Prof Ewert, you could actually respond to his work.
Its there for all to see and access. Far greater access than any journal article.
But you know you haven’t got even the slightest chance of putting together a decent rebuttal, so you sit there and rant aimlessly, because its all you have available to you.
“The cooling has hit every continent except for Australia, which warmed by 0.6339°C since 2000.”
I suspect Prof Ewert was using BOM data, and didn’t realise it was already “adjusted”
UAH says otherwise.
http://s19.postimg.org/evqcc7gz7/Austfrom2000.jpg
cfgjd-
WE’RE BEGGING YOU TO LET US STUDY THE ADJUSTMENTS.
Please, show us where to find the calculations used to get us from the measured data to the reported numbers. That’s all we’ve ever asked for.
If someone does not speak French you will never prove a point to them by explaining that point in French.
Martin and cfgjd demand proof that the adjusted temperatures are not correct. Unfortunately, neither of them speak Math. Or Science. Obviously, they both have good English skills, so they can read what has been posted here — but all they understand of it is a sort of hollow, quacking sound.
Using their own logic, we can safely say that their incomprehension of math and science must be taken as true until that time that they prove it to be otherwise. So far, they have not presented any evidence.
No proof of a fraud has been presented. Smoke and mirrors it seems.
All data tampering is fraud, by definition.
The Iceland Met Office says the adjustments to their data are falsehoods. Please explain.
Sorry cfgjd — Proof of fraud was presented, but you do not have enough science or math skills to understand it. Until you present proof (rigorously studied and peer-reviewed) we have no option but to consider your lack of skills as a given.
CFool says: “No proof of a fraud has been presented. Smoke and mirrors it seems.”
>>>>>>>>>>>>>>>>
Try using that ‘logic’ on the IRS after they confiscate your bank account! They will laugh as they strip you of all your cash.
“I’m just a simple sailor…”
At least he admitted that he was unqualified to be an Admiral.
Submit to a Journal or it does not exist…simple rule. And in the Open Review journals the comments of the anonymous reviewers and the responses to the comments are visible to all so “pal review” cannot succeed. Just publish, there are no excuses!
BULLSHIT….METER….OVERLOAD……MUST..GET……OUT….BEFORE…..IT……BLOWS
Blah blah blah…got a reference for that btw?
https://www.youtube.com/watch?v=-UbNc5IVXmE
Are you seriously saying that if something doesn’t appear in a journal, it does not exist?
Are YOU in a journal somewhere? No? I guess by your own logic, you don’t exist.
Since you don’t exist, could you go and do it somewhere else?
In the day of open access open review journals there’s absolutely no reason to not submit to such a journal….except if one is not confident in their own work. Blog-posts are entertainment but scientifically worthless.
More meaning evasion of the truth.
You poor waste of space.
I repeat.. if these blog journal posts are so worthless, why are you wasting your obviously valuable time (roflmao) with your meaningless ranting.
These blog journals obviously scare the crap out of you, because you know the alarmista cultist cannot control the message.
And you particularly have shown that you don’t have the capability to actually argue against anything to do with maths or science.
“In the day of open access open review journals there’s absolutely no reason to not submit to such a journal”
You’re absolutely right. There’s simply no excuse not to publish the adjustment algorithms.
I will publish the adjustment al gore rhythm here:
1. Is it before 1960? If yes, go to 2 if no, go to 5.
2. Did the temperature rise? If yes lower it.
3. Did the temperature drop? If yes lower it more.
4. Did the temperature stay the same? If yes lower it.
5. It is after 1960:
6. Did the temperature rise? If yes raise it more it.
7. Did the temperature drop? If yes, raise it.
8. Did the temperature stay the same? If yes, raise it.
Morgan-
Until someone can offer an alternative, yours stands as the only one in existence. I don’t think it’ll stand up to the peer review that cfgjd keeps demanding.
cfgjd-
Would you like to submit an alternate, or should we start reviewing Morgan’s algorithm? I’m trying to give you every opportunity to make your case, but I can’t make it for you. It’s not that I’m unwilling. I simply don’t have access to the information.
Morgan, I agree with your algorithm.
If Martin or cfgjd had even an elementary understanding of statistics then they would understand that any true “corrections” would be distributed in a random fashion and not clearly follow a trend, lower before a certain date, higher after a later date. The point that the Y axis (that’s the one on the left-hand side of the chart, Martin) crosses from negative to positive adjustments 1977 or so.
I can’t “prove” fraud, but GISS refuses release the methodology used to “prove” their adjustments for open review. They have gone so far as to even refuse requests from congress to do so.
The only “proof” is the fact that they say they proved it and they got it in a “peer reviewed” journal. So you’ll have to excuse us from not buying into it.
As to the topic of “peer-reviewed journals”, are you vouching for the inerrancy of every article EVER published in a peer-reviewed journal? Even articles that contradict previously published in other peer reviewed articles? Do you have a big leather bound illuminated copy of journals that you proudly thump for skeptics? “It’s in the Bible, er … I mean a Peer Reviewed Journal. I believe it. End of conversation.”
The bottom line is that the results of these “adjustments” serves to bolster the AGW predictions of warming by both cooling the past and warming the present. Excuse us if we’re suspicious of a set of data that is derived by using an unpublished methodology that conveniently delivers exactly the results to “get rid of the hiatus”.
“Submit to a Journal or it does not exist…simple rule”
There is only one simple thing here, and that is you.
It is published.. right here , right now.. its there in front of you.
Again.. How many journal articles have you read.. very few , I bet.
If the lack of journal article makes it non-existent, why are you wasting so much of your worthless time arguing against it..
Because you absolutely HATE that REALITY is getting past the climate journal gatekeepers, that’s why.
And you absolutely HATE it that you totally unable to put up any scientific argument against it.
That’s why you carry on with the moronic stupidity that you do.
There cannot be any gatekeepers to an open review journal, so your point is moot. Of course, factually crap or sloppy research does not pass a fair and square open review which turns posers away.
you mean like Wiki
Crap and sloppy research is what “climate science” is built on.. and its all in journals.
You still are totally unable to put up any scientific argument against anything..
That is the most obvious thing in your aimless meaningless little rants.
No wonder you feel so insignificant.
There are always moderators on those “open access” sites.
And yes.. they have been known to block content that was against the agenda.
You really are SCARED of the truth behind the AGW scam getting out, aren’t you.
So funny to watch you squirming and squealing. 🙂
Hell I can’t even post a comment at the Globe or the LA Times on the scam and this guy is telling me there is not problem publishing in scientific journals that support the AGW meme?
cfgjd-
This IS an open review journal.
But, if we accept both your rules and your definitions, the data adjustments do not exist. The algorithms used in those adjustments have never been published anywhere. They are not available for review. If I’m wrong, it would be trivially easy to prove it. Provide us with a link to the published algorithms.
So are you accepting that the adjustments are fraudulent? Or will you show us the algorithms? Those are the only two alternatives.
This is not a journal of any kind, and I’ve never seen a “review” in here, not even close. Stop kidding yourself.
You have never seem a review, period.
I doubt you have ever read a full scientific journal article in your life..
You don’t have the capability.. as you keep showing.
The only person kidding themselves , is you.
cfgjd-
Why do you choose to respond to that part of my comment, but utterly ignore the request for the adjustment algorithms? Have they been published, or haven’t they? You’re entire argument is based on the claim that they do. My entire argument is based on the belief that they don’t.
The ball is I your court. Where are the algorithms?
CF has just proved he & Martin do not exist. “Submit .. or it (they ) do not exist.”
Others who do not believe this is a requirement do exist.
Admiral Titley Can’t see the forest for the trees
Can’t see the snow for the snowflakes
Can’t see the Sun for the sunshine
etc, etc, ad inf.
God bless high-def TV. When Cruz was questioning him, the Admiral’s hands were visibly shaking, even though his voice sounded relatively calm. He’s dishonest, but not stupid enough to answer questions about the threat posed by climate change honestly, so he was useful to the Democrats on the committee.
Note USCRN for November 2015 , a drop of 1.3ºF
Drop in ClimDiv of 1.19ºF
USCRN trend now 0.0094ºF
ClimDiv trend over same period -0.0135ºF/year
ie basically dead flat in both.
whoops . missed the /year on USCRN trend
Andy-
Can you put up a link?
Thanks.
This should work
http://www.ncdc.noaa.gov/temp-and-precip/national-temperature-index/time-series?datasets%5B%5D=uscrn&datasets%5B%5D=climdiv¶meter=anom-tavg&time_scale=p12&begyear=2005&endyear=2015&month=12
I was digging in “National Temperature and Precipitation Maps” when I should have been in “National Temperature Index.”
Thank you.
That’s all four un-tampered un-fabricated data sets now showing a step down..
(Both satellite sets + USCRN and ClimDiv)
Considering the position of the current El Nino, this is quite puzzling.
I expected a couple more months of warming atmospheric temperatures at least.
US national temperatures are irrelevant.
Yes, because the US is not part of planet Earth.
But polar temperatures are? Oh wait, only one pole, the other one isn’t relevant.
Again your ignorance of sample validation comes to the fore.
You really don’t understand anything about anything do you..!!!!!!
And, yes you have made it perfectly clear that REAL un-tampered DATA is totally irrelevant to you.
Titley called on the carpet…
https://www.youtube.com/watch?v=bTM13sI2BFQ
With fake data you can get rid of that pesky pause and drill right down to the graphic result that you really want, despite reality.
Reblogged this on Climatism.
Reblogged this on Climatism.
So could you call this ‘conspiracy’.
If yes do you think it has been the first time ?
Your graphs came up at the Senate hearing yesterday used by Cruz. Now B.S. is panning them with pretty serious allegations.
“The point here is, Mark Steyn, Ted Cruz and to a lesser extent Judith Curry, all accepted as fact that these charts were valid. They aren’t. They’re complete and utter bunk. They exist solely because some paranoid nutjob on the internet who constantly rants about how global warming is a hoax decided to create some charts even though he has absolutely no idea what he is doing.”
http://www.hi-izuru.org/wp_blog/2015/12/ted-cruz-endorses-steven-goddard/
http://rankexploits.com/musings/wp-content/uploads/2014/06/Averaged-Absolutes.png
“There is a very simple way to show that Goddard’s approach can produce bogus outcomes. Lets apply it to the entire world’s land area, instead of just the U.S. using GHCN monthly:”
They make the pause in warming even longer. 1952 – now . And no CO2 signature at all.
Just curious, Glacierman. Have you been losing weight? Al Gore says you’re much smaller than you used to be.
Yes, but I usually add significant mass over the holiday season.
Glacierman, I don’t think the charts are utter bunk. I wrote a C program that loads the raw and adjusted USHCN (or GHCN) data, and, uh, “skillfully infills” the many missing temperatures. The temperature anomaly (not absolute temperature) is then calculated from 1900 to 2014. The (adjusted – raw) monthly values increase by ~0.4C degrees over that period. I can change the infill algorithm, number of stations used, number of infill passes and the adjustment value remains about the same.
I didn’t think the adjustment value was in question. I thought the argument was whether or not the undocumented and outside of previous confidence interval adjustments were valid (or fraud if you prefer).
I can’t see a difference between those two land and ocean charts
Do you mean the animated gif showing NOAA figures for June 2014 v June 2015?
If so, there must be something wrong with your browser.