
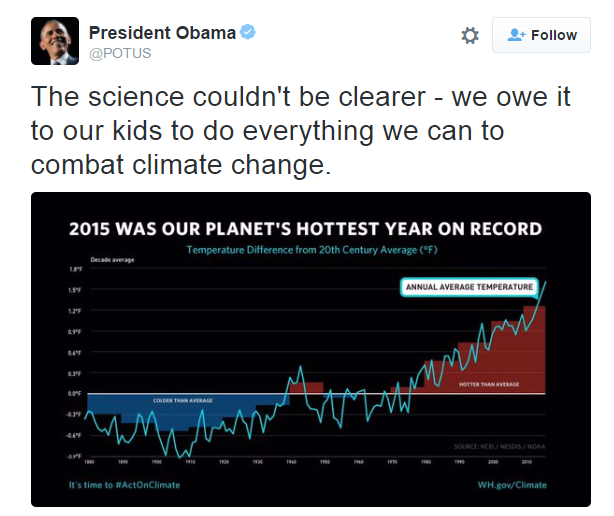
2015 was the most fraudulent year on record at the White House. Their claim is utter nonsense.
NASA’s surface temperature record shows 1.6C warming since the 1880’s, and 0.8C warming during the century from 1880 to 1980.
Their 1981 version of the same graph only shows a little over half that much warming from 1880 to 1980.
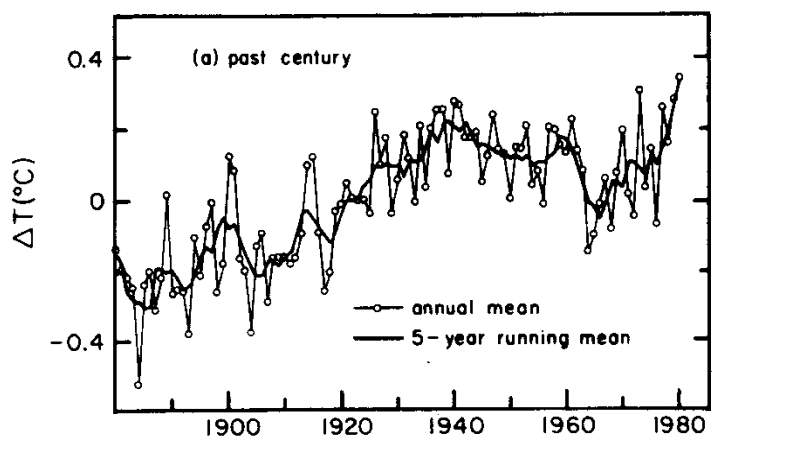
The next graph overlays the two above at the same scale, normalized to the late 1970’s. NASA has massively cooled the past, far outside of their own error bars.
They added about 0.3C warming prior to 1980 by altering the data, and show another 0.2C warming since 2001, during a time when satellites show cooling.
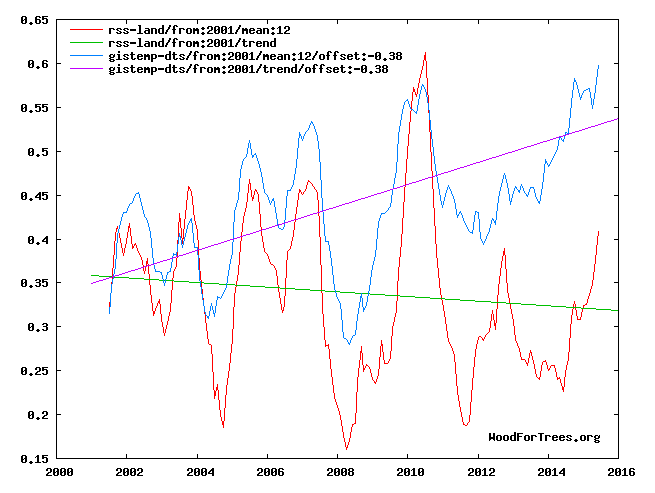
Wood for Trees: Interactive Graphs
Most of their surface temperatures are fake. There are vast areas of land with little or no temperature readings, and many of the thermometers they do have are contaminated by urban heat island effects.
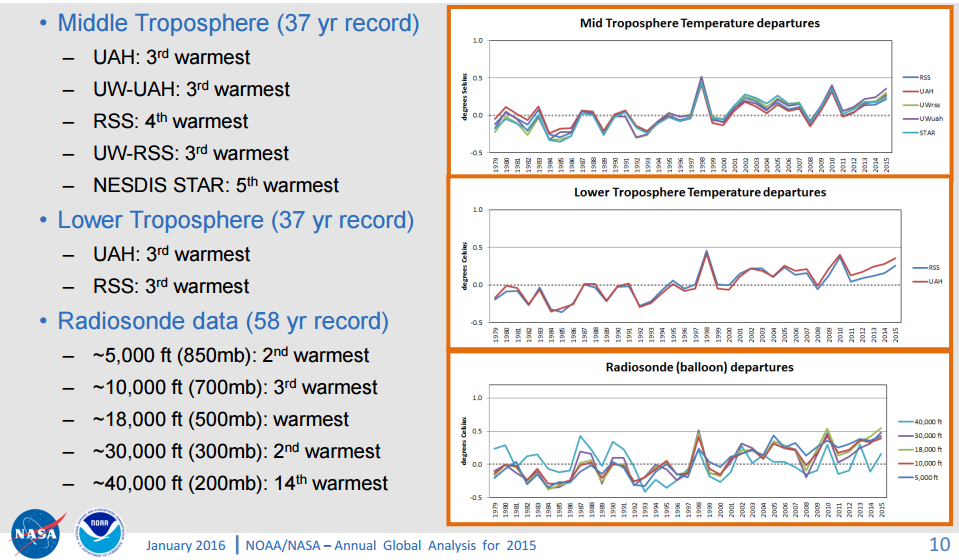
Global warming theory is based on warming in the troposphere, not in urban heat islands and fake data. NOAA and NASA’s own satellite and radiosonde data shows little or no warming in the troposphere over the last two decades, and that 2015 was not the warmest year.
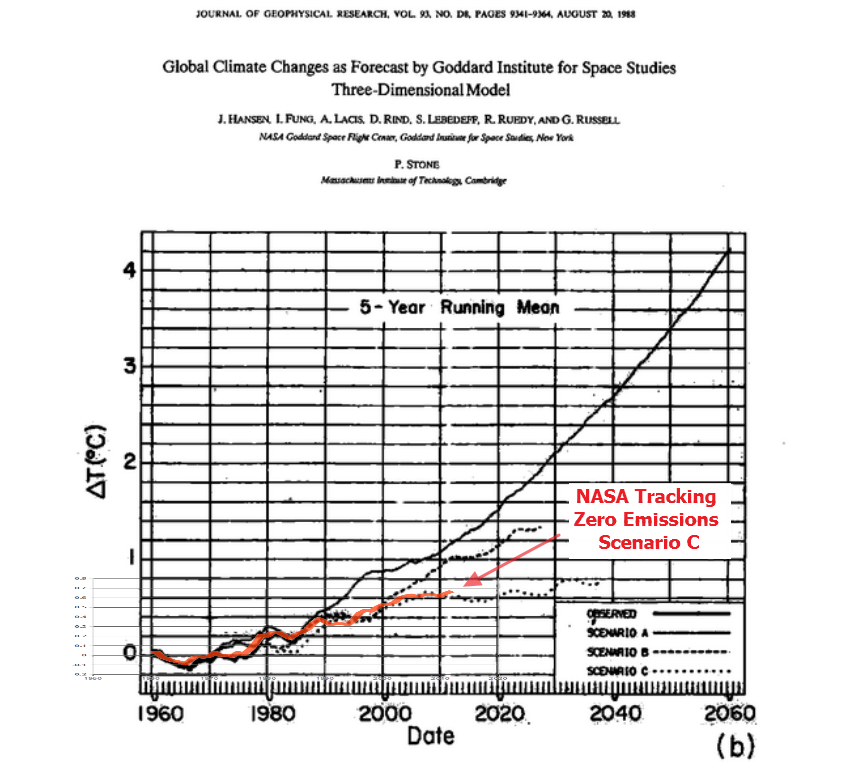
But the real fraud lies below. Even with all of the NASA and NOAA data tampering, they are still tracking Hansen’s zero emissions scenario C.
data.giss.nasa.gov/gistemp/graphs_v3/Fig.A2.txt
pubs.giss.nasa.gov/docs/1988/1988_Hansen_etal_1.pdf
![]()
1988_Hansen_Senate_Testimony.pdf
There isn’t any climate crisis. There is a massive fraud crisis – in Washington DC.

Reblogged this on Climate Collections.
yeah
save your kids from climate change
murderous, apocalyptic 7th century lunatics are no problem
It looks as if another year of lies has to be tolerated before a new POTUS can do anything. That is if the new POTUS is an AGW skeptic, and has the moxie to get rid of the AGW fraudsters.
Another important consideration that is commonly ignored is the uncertainty in all of these global temperature anomaly estimates. HadCRUT and BEST include uncertainty estimates, but they are much too low. In recent decades, the annual uncertainty for the global temperature anomaly estimates is probably at least plus or minus 0.3C to 0.5C and possibly more. So we can only say that 2015 is probably among the highest over the period of record. But we can’t be sure with any significant confidence that it is the highest. Statements calling it the highest are grossly misleading just from this aspect only (not to mention all the evident tampering involved).
Too bad we don’t have a period of record of thousands of years. From what I have read, there is plenty of evidence to suggest that global temperatures during the Holocene optimum roughly 5,000 to 9,000 years ago may have been at least 1C to 2C higher than 2015.
>Too bad we don’t have a period of record of thousands of years.
There are abundant proxies and data showing the Holocene climatic optimum was warmer than any recent period, and that the global climate has cooled since then. You just won’t find them on Wikipedia, or in the global warming world.
For some reason global warmers fear any data that shows it was ever as warm as now. It’s obscene really.
>There are abundant proxies and data showing the Holocene climatic optimum was warmer than any recent period, and that the global climate has cooled since then.
Yes, I’ve blogged about various ice core proxies, but the uncertainties with these proxies are probably on the order of plus or minus 1C to 2C or more, which is considerably larger than what we can derive from data during the satellite era. Our modern approaches to estimating global temperature anomalies are essentially proxies as well, but more accurate proxies than the paleo proxies. We can’t directly measure the global temperature by any method and global temperature is more of a concept than a fact.
The standard surface temperature measurement height in the US is 2 meters above the ground. In England it is 1.25 meters above the ground. So, what is the surface temperature anyway? Is it the temperature 2 meters above the ground in the shade of my backyard? Is it the temperature 2 meters above my concrete patio? Is it the temperature 2 meters above the roof of my house? Is it the temperature at 2 meters above the ground under the canopy of a jungle or forest? Is it the temperature in an open field 2 meters above grass? Is it the temperature 2 meters above a paved parking lot? Is it the temperature 2 meters above desert sand? Is it the temperature 2 meters above the roof of a skyscraper? Is it the temperature 2 meters above the street in a downtown skyscraper street canyon? Is it the temperature 2 meters above the top of the highest mountain peaks? Is it the temperature 2 meters above the top of the troughs between waves in an ocean storm with 20 meter waves? Is it the temperature 2 meters above the top of each wave in an ocean storm with 20 meter waves? This list could go on and on. In reality, when looking at the earth from straight above, all of these locations are at the “surface” and all surface locations together combine to represent the “global surface temperature”.
The surface of the earth is about 510 million square kilometers. That means we would need 510 million temperature sensors evenly spaced around the globe just to have one measurement per square kilometer. Even then, there are many mountainous areas where a single measurement is not likely to represent the average temperature over a square kilometer area very well. Likewise in the middle of a large city. This is part of why I believe that our best estimates of global temperature and global temperature anomalies are woefully inadequate and come with a large uncertainty.
Look at this article by Tim Ball and the Picea glauca (white spruce) stump on the Tuktoyaktuk Peninsula in tundra, some 100km north of the current treeline that is dated at 4940 years old. It is a significant tree now far north of the tree line and it tells you something about the temperatures at the time it grew vs current GLO-BULL warming.
the link: http://drtimball.com/2012/sensationalist-and-distorted-climate-stories-increase-as-climate-science-failures-exposed/
And that doesn’t even get into the fact that ‘wet’ air is cooler than ‘dry’ air containing the equivalent energy.
Fraud, a tool of feudalism before 1543 and after 1945:
The scientific revolution was initiated, and the feudal system of slavery subsequently destroyed, by Copernicus’ discovery of a giant fountain of energy at the gravitational center of the solar system in 1543.
After Einstein showed in 1905 that the fountain is powered by the conversion of mass (m) into energy (E), E = mc^2, warring nations competed and finally ended WWII on 6 Aug 1945, using the FORCE of E = mc^2 to vaporize Hiroshima.
Nations were united on 24 Oct 1945 to avoid worldwide nuclear annihilation and totalitarian rule was re-established by using public funds to provide research funds to scientists who hid from the public the FORCE that actually controls our destiny:
https://dl.dropboxusercontent.com/u/10640850/The_FORCE_of_Creation_Preservation_and_Destruction.pdf
Today worldwide NAS’s (National Academies of Science) and DOE’s (Departments of Energy & Education), and the news media still hide from the public Figure 1, which shows exactly how much energy (E = mc^2) is stored in the rest mass of each of the ~3,000 types of atoms that compromise all matter in the solar system.
To break the current chains of worldwide tyranny will require open dissemination of information in the “Cradle of the Nuclides” by the news media, the National Academies of Science, Departments of Energy, educational and research institutions.
The worldwide climate of fear is CERN’s primary product:
https://en.m.wikipedia.org/wiki/CERN
This is apropos-
http://cliscep.com/2016/01/22/2015-smashes-the-record-for-climate-bullshit/
Here’s what boggles my mind. Am I missing something? All the effort they put into error corrections to show more cooling in the past so that the overall slope would change, but that’s going back to 1880, sixty years before the industrial era began. That makes the very first graph you posted even more damning to the AGW hypothesis, even if accepted as-is. Did they forget that the hockey stick needs a nice flat handle leading up to the AGW “anomalous” slope? Wouldn’t they want to show the climate flatlined and stable, with a sudden upward burst in temperature? All I see now is that the world, according to the latest graph, was warming considerably, and has continued to warm along pretty much the same trend line.
And if it really is so much warmer now, why are there not a lot more northwest passage transits recently than much longer ago when it was supposedly that much cooler. The lies make no sense and I hope that eventually it will become plain to many more.
Hey Steven Douglas! “That makes the very first graph you posted even more damning to the AGW hypothesis, even if accepted as-is.”
You are, of course, exactly right — except that the average CAGW enthusiast is not rational. More accurately, they are not rational about their belief in CAGW; they may be perfectly rational about other subjects. CAGW has been sold on an emotional basis, not on a scientific or logical basis. Why else do you see the “cuddly polar bears” meme. For goodness sake, they are one of the most deadly and ferocious predators on the continent. Cuddly, they ain’t!
http://www.blackbearheaven.com/polarbear/1.jpg
Pictures of Polar Bear Attack — They are gruesome.
https://youtu.be/y97j5hD1fG8
At about 55 seconds in a lady speaking of the bear actually says, “I think that she is going to be really beautiful and cuddly!”
We, as a species, have created conditions that allow procreation and survival of idiots.
Steven, good point, they have painted themselves into a dammed if they do, dammed if they don’t corner.
However they have suceeded in making their post 1979 rise steeper.
Another of their own graphs, showing very little warming from 1980-2000
https://i1.wp.com/realclimatescience.com/wp-content/uploads/2016/01/2016-01-04-17-05-54.png
Compare to the steep slope on the GISS fabrication (Fig A)
Most of their surface temperatures are fake. There are vast areas of land with little or no temperature readings, and many of the thermometers they do have are contaminated by urban heat island effects.
Not only the land but the oceans too.
Size of the Five Oceans – 146,508,000 sq mi
NCDC/NOAA get the sea temps from ICOADS 2.5
https://www.ncdc.noaa.gov/data-access/marineocean-data/extended-reconstructed-sea-surface-temperature-ersst-v4
Background Information
ERSST v4 revisions are based on ERSST v3b. Major improvements include updated and substantially more complete input data from the ICOADS Release 2.5, revised Empirical Orthogonal Teleconnections (EOTs) and EOT acceptance criterion, updated sea surface temperature (SST) quality control procedures, revised SST anomaly (SSTA) evaluation methods, revised low-frequency data filing in data sparse regions using nearby available observations, updated bias adjustments of ship SSTs using Hadley Nighttime Marine Air Temperature version 2 (HadNMAT2), and buoy SST bias adjustments not previously made in v3b. These revisions and their associated improvements are justified in part by subsampling the observations of the modern period (1960–2012) using historical observation masks from the period 1860–1912.
ICOADS 2.5 has this image
Figure 2. Annual distribution (1662-2007) of major platform types in Release 2.5 (and total) shown as reports per year (logarithmic scale). Ships (mainly VOS plus some R/Vs; and prior to ~1892 hidden by the R2.5 curve), buoys, and oceanographic are self explanatory, Ocean (permanent) Station Vessel = OSV, Coastal-Marine Automated Network = C-MAN, ocean drilling rigs/platforms and other small entities = other, and unidentified platform types = missing (note: most are probably early ship reports).
http://icoads.noaa.gov/images/index_fig2.gif
That is 10,000,000 readings. Of which 1,000,000 per month come from drifting buoys and about 800,000 that are lost ship records.
In this pattern.
http://icoads.noaa.gov/images/index_fig1.gif
But no worries, they have an app to correct everything and make it ‘just right’..
you can eliminate errors due to stations siting and UH effects and erroneous recordings by rather looking at the change in the speed of warming /cooling
like I did here
https://i0.wp.com/oi62.tinypic.com/33kd6k2.jpg
I find earth is cooling
With a dumb down brainwashed population government could even get away with murder.
Remember that most people just want free stuff like Obama phones.
https://youtu.be/kGdH7iGNqlY
“The notion that world-wide weather is becoming more extreme is just that: a notion, or a testable hypothesis. As data from the world’s biggest reinsurer, Munich Re, and University of Colorado environmental-studies professor Roger Pielke Jr. have shown, weather-related losses haven’t increased at all over the past quarter-century. In fact, the trend, while not statistically significant, is downward. Last year showed the second-smallest weather-related loss of Global World Productivity, or GWP, in the entire record.”
http://www.wsj.com/articles/the-climate-snow-job-
A warmer world means LESS extreme events. It is the switch from the interglacial to the glacial state that is the really wild weather.
Rapid sea-level changes at the close of the last interglacial (substage 5e) recorded in Bahamian island geology
I want a government that gives me free housing, free food, free college, free car, free dope, free condoms, and free beer. I don’t want to work, I want to be stoned all day.
To pay for it, we take money from rich people and evil corporations. Why should the corporations give us all their money? Because they make carbon.
Vote for Bernie.
throw in a maid and yard service and you’ve got a deal
Don’t for get the wide screen TV. I wanna have a propaganda tube too!
No Morgan, that would make another “too stupid to spend his own money” socialist.
Hee hee.
Alarmists’ claims are akin to the Martian canals thing you posted. Sometime in the future people are going to be having a real giggle over alarmist BS, probably way more than those giggling over the canals thing now, given the reach of news right now
These Adjustments, can they be applied to the raw data in reverse? obviously they would produce a great deal of cooling and warm the past but I would really like to see the stark difference between a cooling trend adjustment and a warming trend adjustment of the same value because any adjustment to the raw data obviously falls into a margin of error, so the larger the raw data adjustment in any direction, then the greater the margin of error will be… I’m sure this has to be correct!
The CAGW supporters seem to not care much about error bars. Usually they are not included. If you find some older charts that do have error bars on them, you will find that the current adjustments not only warm the recent couple of decades and cool the older decades, but that the adjustments actually go beyond the old error bars.
Good science? I think not…
Reblogged this on Climatism.