

Climate scientists cleverly start their sea ice graphs at the year 1979, which was after the third consecutive very cold winter, and the coldest winter of the last century. So of course there was a huge amount of ice.
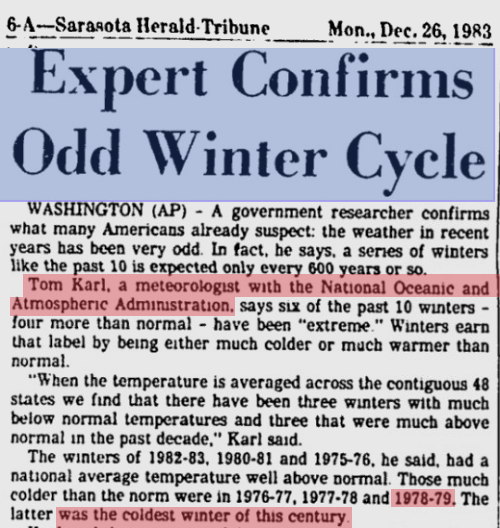
Sarasota Herald-Tribune – Google News Archive Search
The 1990 IPCC report contained high quality NOAA satellite data back to 1974, which showed almost two million km² increase in ice from 1974 to 1979.
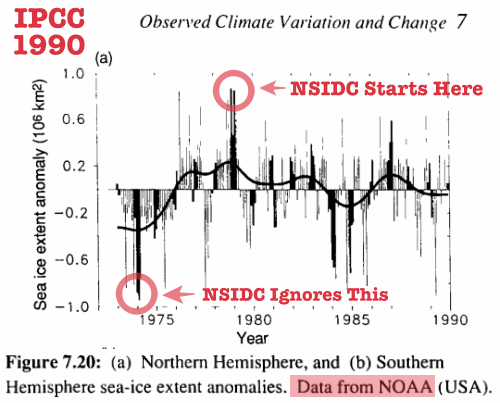
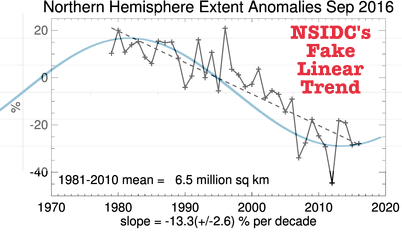
NSIDC ignores this data, because it would show how fraudulent their linear trend is.
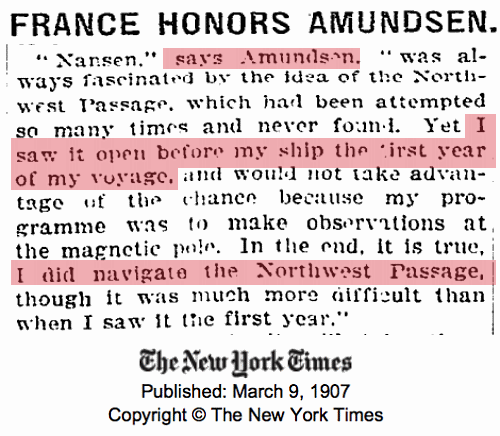
The Northwest Passage was open in 1904. If you believed the propaganda from NSIDC, you would think there was 50 feet of ice there a century ago.
