
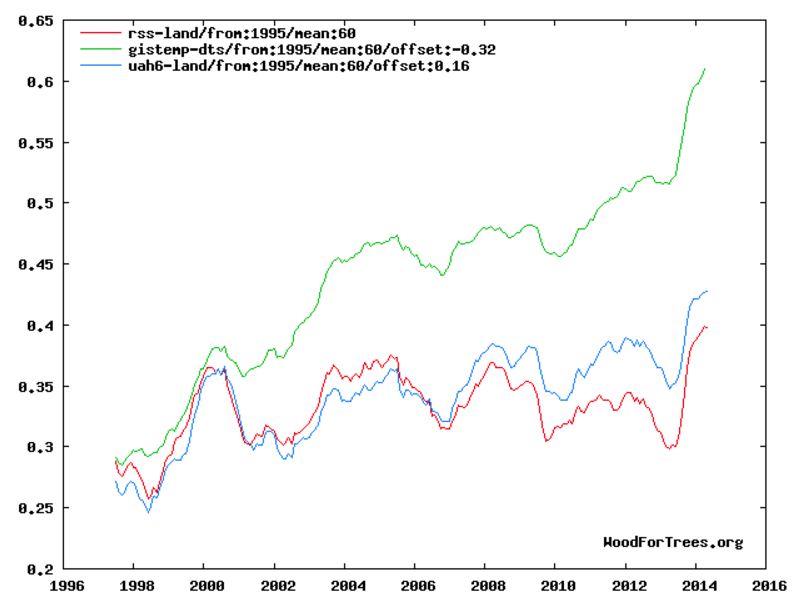
I generated this graph on November 16, 2016. Note that all three lines intersected at the year 2000.
Wood for Trees: Interactive Graphs
In today’s version of the same graph, Gavin’s fraudulent green line has been pushed up even further. It is now above the satellite data at the year 2000.
The overlay below shows how Gavin has bumped up his fake data even higher than last month.
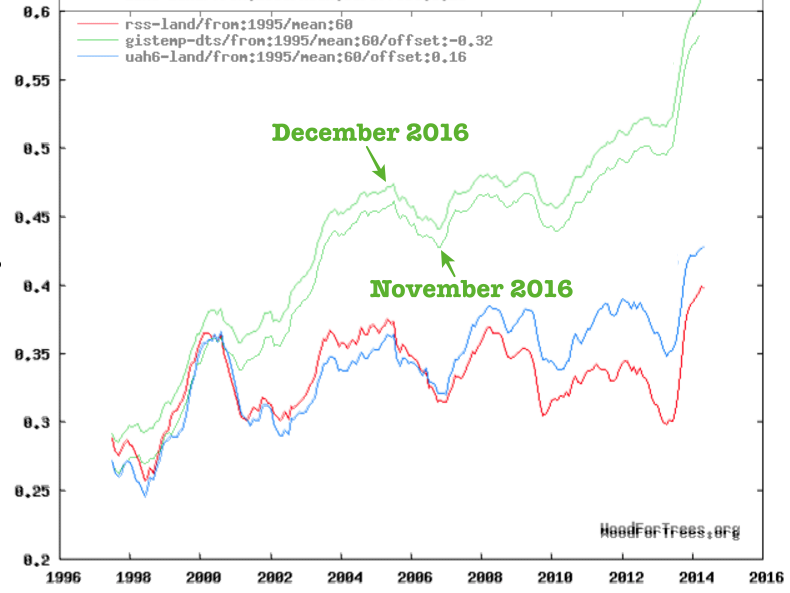
This follow a continuing pattern of Gavin tampering with temperature data month after month, which has caused global warming to nearly triple since the year 2000 – during a time when satellites show little or no warming.
Gavin is a major player in the biggest science fraud in history.
