
According to climate alarmists at Earth-Sky, wildfires are on the increase in the US, and 2005, 2006, 2007, 2011 and 2012 were record years.
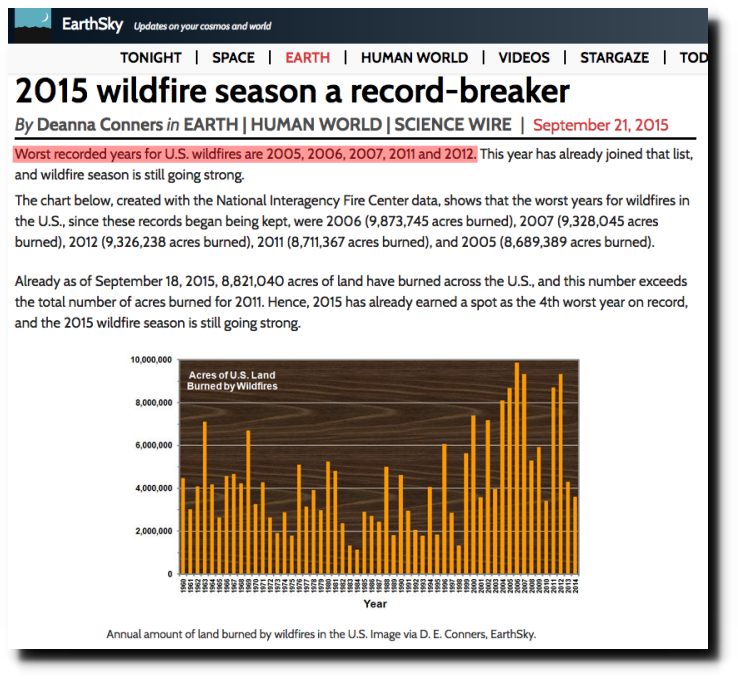
2015 wildfire season a record-breaker | Earth | EarthSky
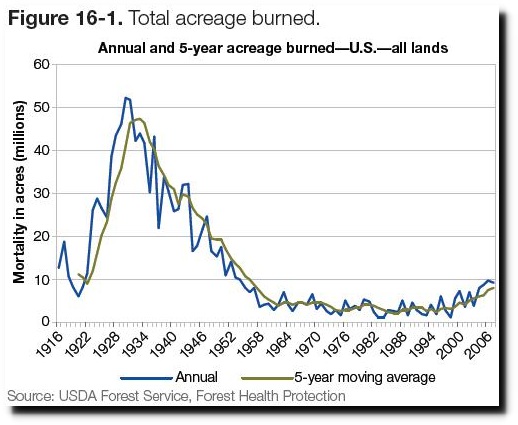
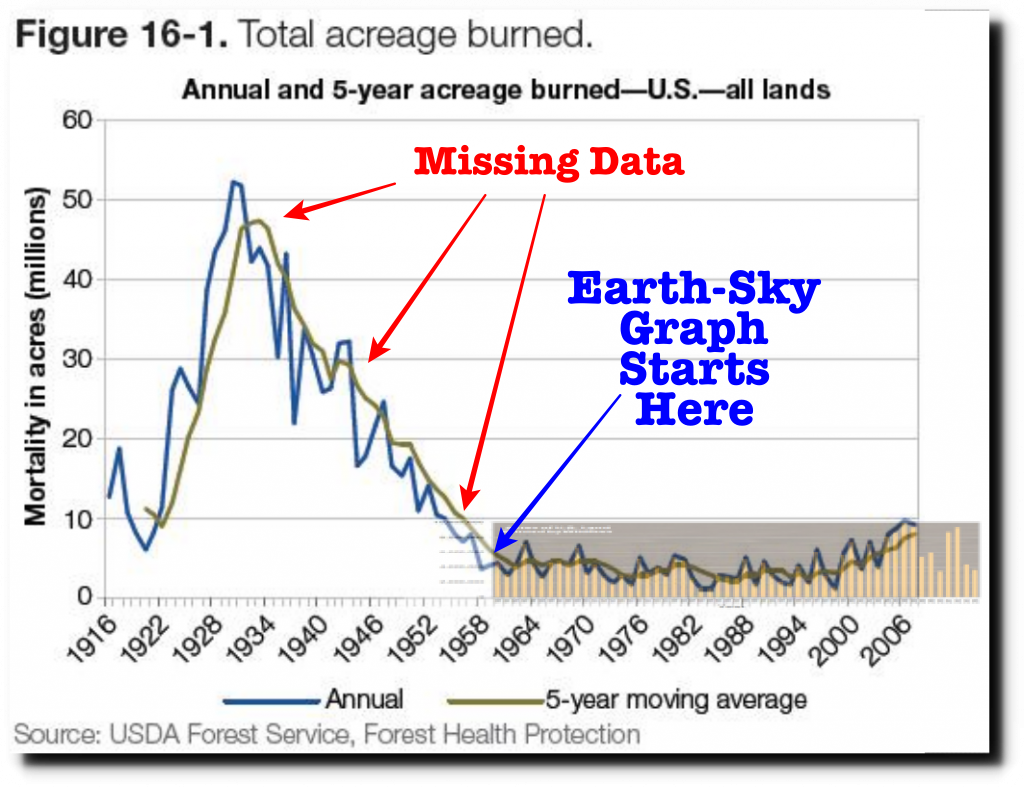
The graph above starts in 1960, and it isn’t hard to see why. Their graph starts at one of the lowest years on record. The graph below is a much longer record from the US Forest Service.
Indicator 3.16: Area and percent of forest affected by abiotic agents
I overlaid the two graphs at the same scale below, showing the spectacular fraud behind the start date of 1960 in the 1960-2014 graph. Their record high years were actually closer to being record low years.
The USFS graph is quite real, and correlates well with newspaper reports from the time.
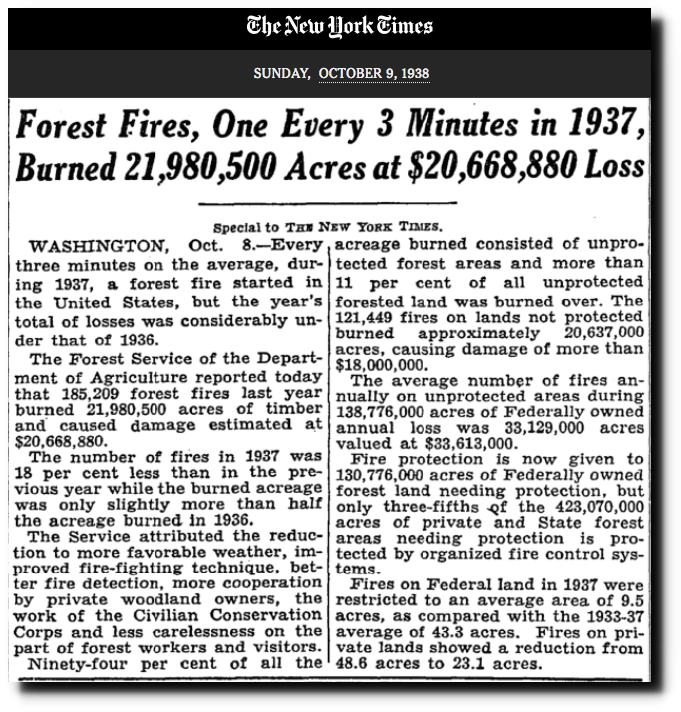
TimesMachine: October 9, 1938 – NYTimes.com
Forest fire burn acreage is down 90% since CO2 was 280 PPM.
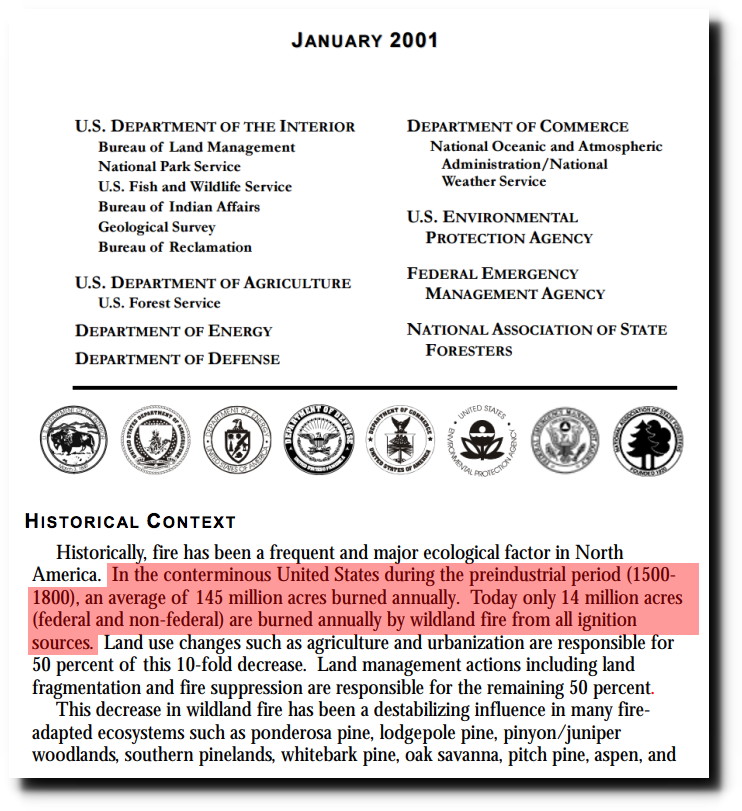
https://www.nifc.gov/PIO_bb/Policy/FederalWildlandFireManagementPolicy_2001.pdf
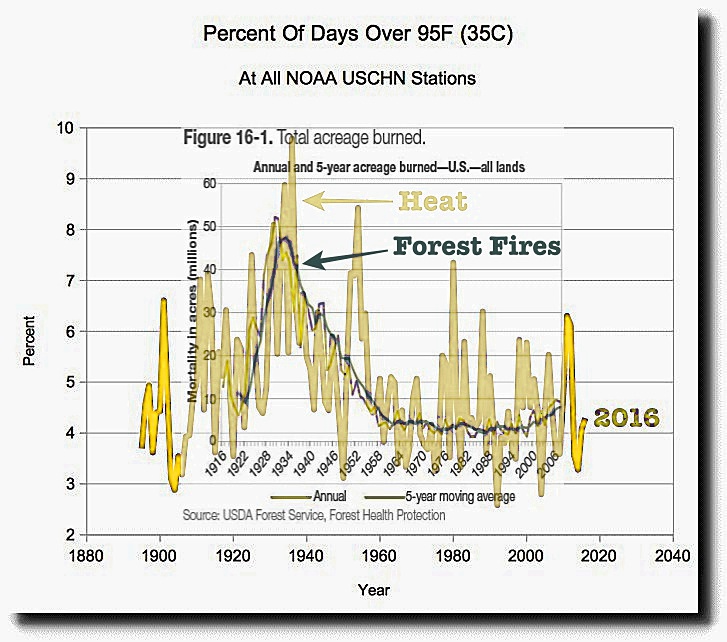
There is no correlation between fires and CO2, however there is an excellent correlation between fires and hot weather. The graph below shows the percent of days over 95F (35C) in yellow, and the fire burn acreage in black. They track each other very closely.
Climate alarmists can’t win the debate honestly, so they cheat, lie, cherry-pick start dates and tamper with data. And then they still lose the debate anyway.
