Hansen, echoing work by other scientists, said that in five to 10 years, the Arctic will be free of sea ice in the summer.
Rep. Ed Markey, D-Mass., committee chairman, said, “Dr. Hansen was right. Twenty years later, we recognize him as a climate prophet.”
- June 24, 2008
Ten years ago, NASA’s chief climate prophet James Hansen predicted the Arctic would be ice-free no later than this summer.
The Argus-Press – Google News Archive Search
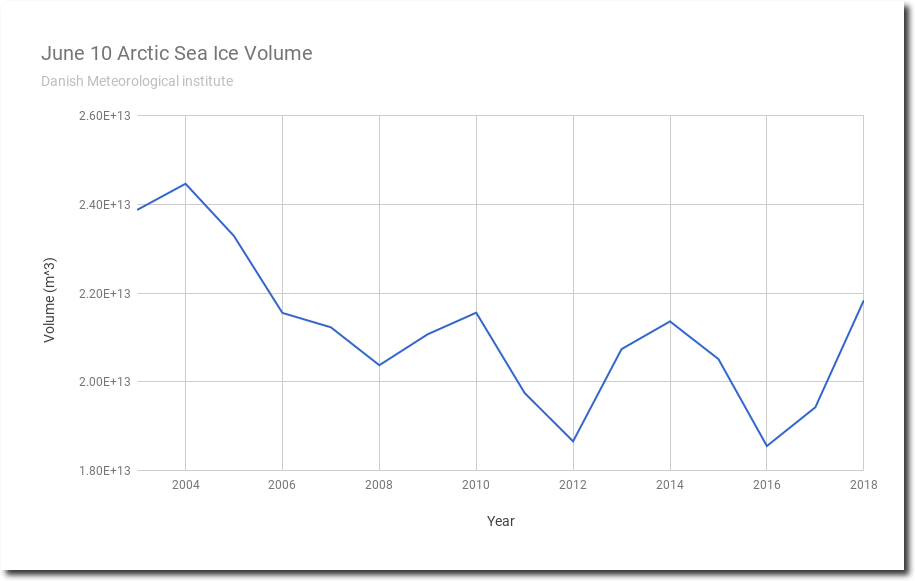
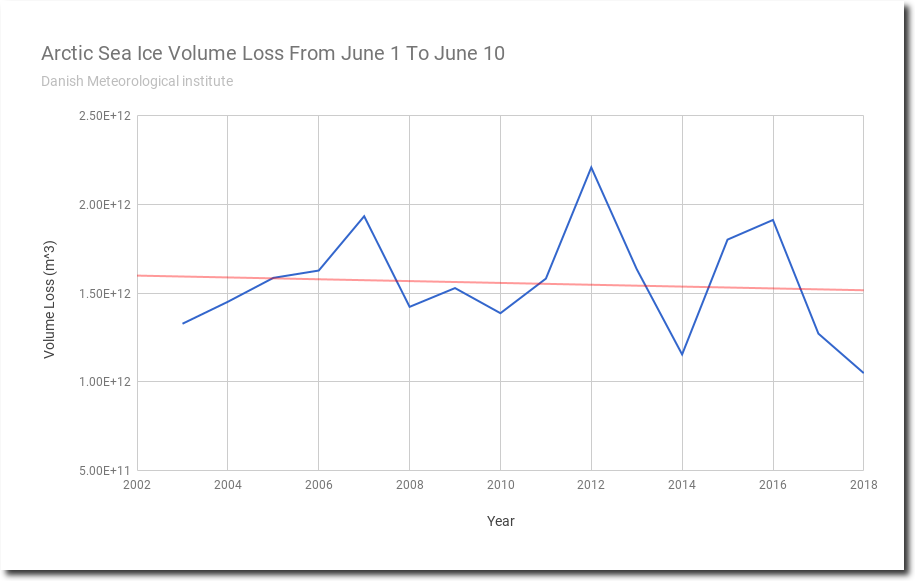
Looks like big trouble for government climate prophets. Arctic sea ice volume is up 7% from when he made his prophesy, and melting at the slowest rate on record.
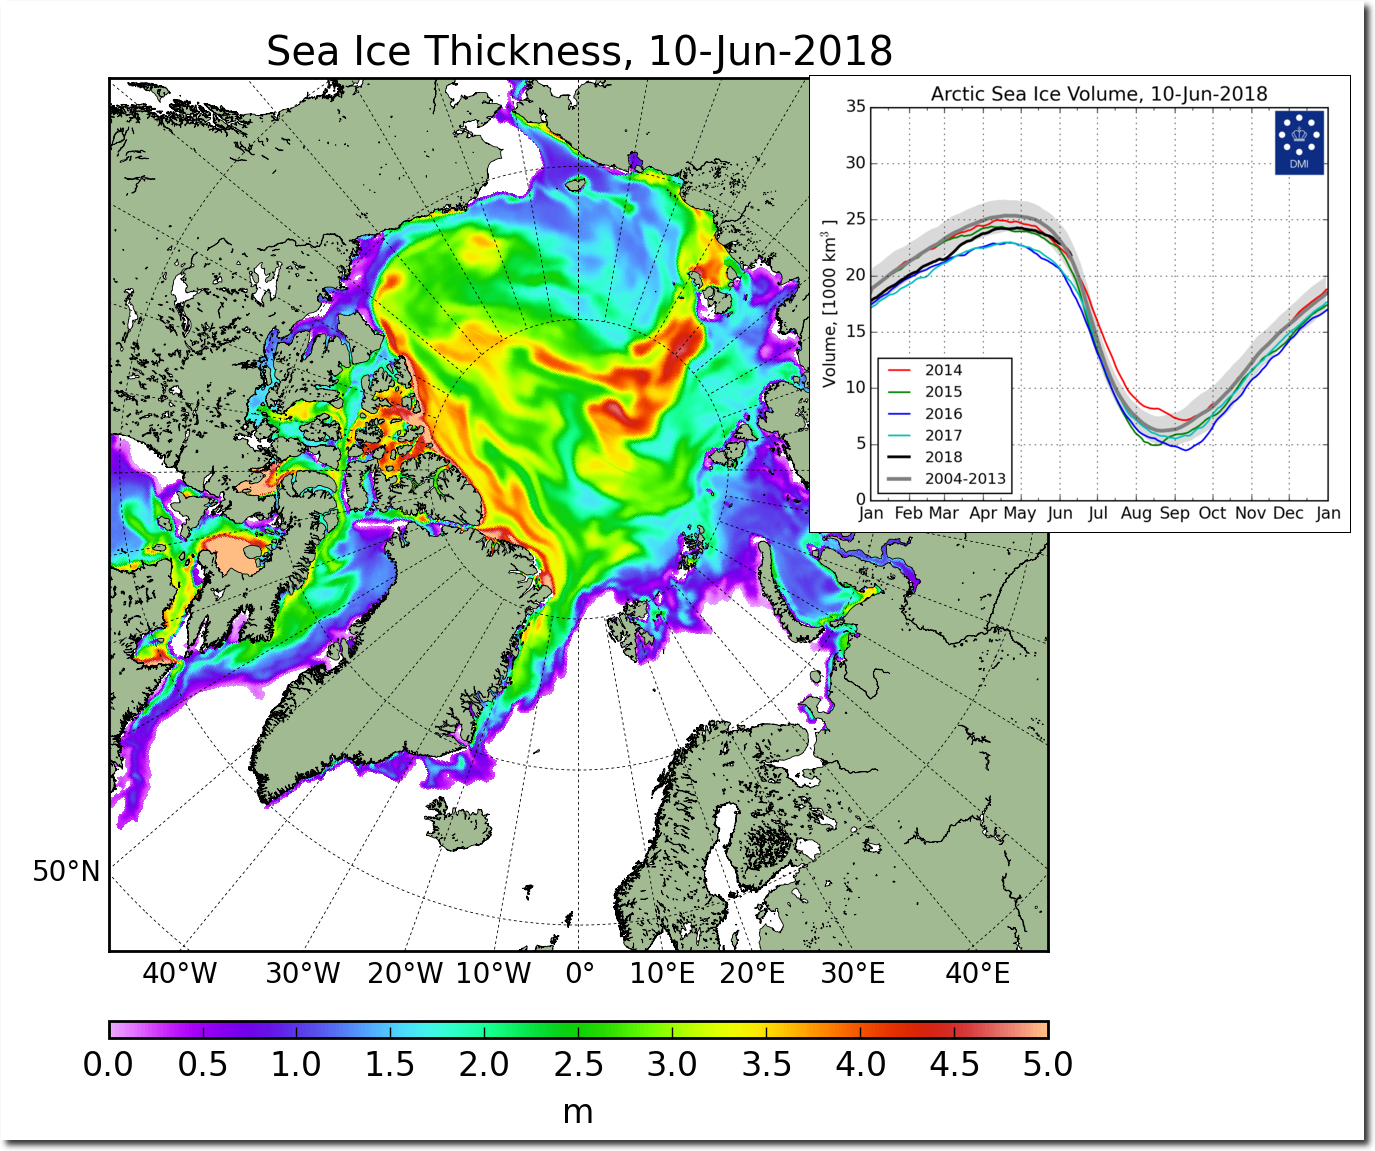
FullSize_CICE_combine_thick_SM_EN_20180610.png
FullSize_CICE_combine_thick_SM_EN_20080610.png
But to be fair to Dr. Hansen, he was a very conservative prophet. The other leading Norwegian, American and Canadian prophets predicted the North Pole would be ice-free ten years ago.
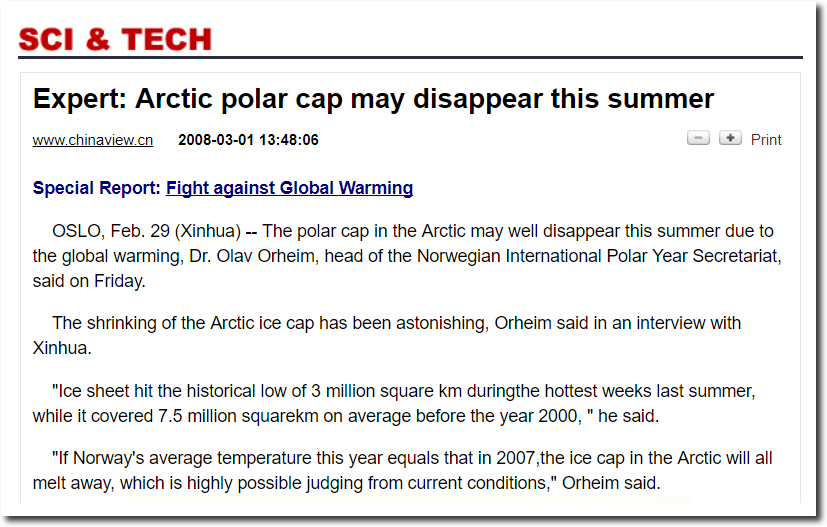
Expert: Arctic polar cap may disappear this summer_English_Xinhua
North Pole to be ice-free in 2008.
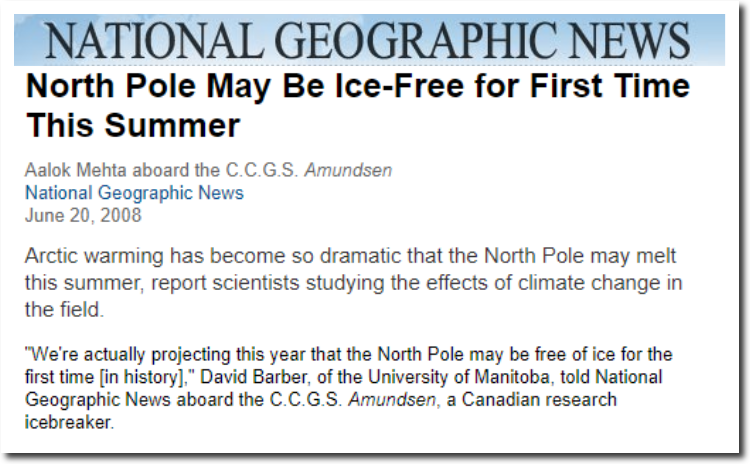
North Pole May Be Ice-Free for First Time This Summer
North Pole could be ice free in 2008 | New Scientist
Based on the advice of these experts, Lewis Pugh tried to kayak to the North Pole.
Trend is strongly down.
here
The alarmist cherry-picked 1979 start date chart is strongly down, but there is currently more ice in the Arctic than the average of the past 9000 years.
Nothing to see here.
It is not cherry picked but based on data availability and climate reanalysis can confirm that the ice level was not this low any time after the Little Ice Age. The temperature of the Arctic was not totally unknown before 1979.
Science ship data from the 19th Century illustrates ice volume/extent similar to today.
richard please provide your references for that claim.
“Accounts from 19th-century
Canadian Arctic Explorers’ Logs
Reflect Present Climate Conditions”
https://seagrant.uaf.edu/nosb/2005/resources/arctic-explorers.pdf
Richard, thanks for that very interesting article. Did you notice it only covers a very small corner of the Arctic? It would be totally foolish and misleading to extrapolate over the whole Arctic.
As foolish as thinking the Arctic is doing anything out of the ordinary. There is currently more ice in the Arctic than the average of the past 9000 years, Chicken Little.
The 1990 IPCC Report had NOAA Arctic satellite data back to 1971. That data wrecked global warming theory, so climate scientists made it disappear.
The first three they start from day one, the next ones starts at 1979 and change the scale of the charts.
1990 IPCC Report
Chapter 7, Observed Climate Variations and Change:
“Especially importantly, satellite observations have been used to map sea-ice extent routinely since the early 1970s. The American Navy Joint Ice Center has produced weekly charts which have been digitised by NOAA. These data are summarized in Figure 7.20 which is based on analyses carried out on a 1° latitude x 2.5° longitude grid. Sea-ice is defined to be present when
its concentration exceeds 10% (Ropelewski, 1983).”
Tony has referred to this reference many times.
E.G.: https://realclimatescience.com/2017/09/little-change-in-arctic-sea-ice-since-1971/
See Figure 7.20 (a) from the report below.
Interesting. Does the Navy have a version that runs this out to present?
The reconstruction here for a region of the Arctic may interest.
http://lagmansnatursida.se/dbarkiv/2017/vecka09/db17mar03.htm
Have added the graph.
/Not exactly cherry picked/ By starting the graph in 1979, one can construct a simple Semi-Empirical model, which when linearly extrapolated into the future forecasts an ice-free Arctic (this is why all of the predictions and headlines have been wrong). After the erroneous forecast fails the scientists say “our models were wrong” and move on with whatever they are doing.
The real question is why use the Semi-Empirical models and why have they been getting away with it?
ANSWER: To answer that you have to dig deep into the literature. Because the semi-empirical models overstate the effects of of warming, they are preferred by politicians, policy makers, environmental NGOs and the Media:
EXAMPLE:From the reviewer comments section of the latest IPCC report. The reviewer, working for a political entity is pressuring the IPCC to make bolder claims by favoring semi-empirical models:
This chapter overemphasizes physical models for sea level rise projections and underemphasizes semiempirical models. Each approach has significant strengths and drawbacks, and should be presented as such in balance, with projections from each approach featured in the Executive Summary and within the figures. The key challenge with physical models – which remain the ideal approach – comes from modeling ice sheet behavior. Our ability to do so feels oversold in the chapter, especially the Executive Summary, which hails the advance of including contributions from ice-sheet flow, without explicitly admitting that modeling has not
advanced far enough to offer different projections for different emissions scenarios, a critical shortcoming. Ice
sheet decay is by far the largest term in potential sea level rise, so projections with special weakness in this
area need to be appropriately qualified.
Considering this weakness, it is curious that simple extrapolation of recent ice sheet decay trends appears to
have been excluded from consideration, as employed, for example, within the US National Research Council (2012), resulting in ranges substantially larger than the value used in the second order draft. In the same spirit of humility with which physical model based projections should be treated, given the state of ice sheet modeling, I would argue that we cannot exclude semi-empirical projections – especially considering that they achieve superior hind-casts of sea level than physical models do. More strictly physical models are more appealing at a philosophical level, but the fact is that we are extrapolating into uncharted waters no matter what approach we take, given the speed and extent of warming we project. Suppressing projections from semi-empirical models suppresses the extent of our uncertainty.
There may be no consensus on their reliability – but there may also be no consensus on the utility of
incomplete physical models. There is mounting evidence that IPCC reports have a bias toward underprojection.
This may seem “conservative” from a scientific perspective, but it also seems reckless from the
perspective of advising nonscientists concerned with safeguarding lives, property and livelihoods.
This chapter should more evenly present both sets of projections with their respective strengths and
weaknesses clearly stated; convey humility about the state of our knowledge; and help policymakers prepare for a future where seas may rise either more quickly or more slowly than we expect.
References: US NRC 2012. Sea-Level Rise for the Coasts of California, Oregon and Washington: Past, Present and Future. Committee on Sea Level Rise in California, Oregon, and Washington; Board on Earth Sciences and
Resources; Ocean Studies Board; Division on Earth and Life Studies; National Research Council
http://www.ipcc.ch/pdf/assessment-report/ar5/wg1/drafts/Ch13_WG1AR5SOD_RevCommResponses_Final.pdf
*If you are curious as to how the Global Cooling Scare developed in the 1970s, it was also due to semi-empirical modeling being to a sinusoidal phenomenon.
@terak
“… not this low any time after the Little Ice Age.”
That’s because for the last 250 years we’ve been steadily climbing out of the Little Ice Age. Had you been somehow expecting to reenter another cooling phase?
Terak ,
It covers the North West Passage ice extent and passage in the 19th century. The alarmists flag up NWP passage and ice extent today as definitive “settled science” example of climate change and yet the data from the 19th century illustrates the level of ice extent and passage is pretty much the same as today.
No, it was cherry-picked. Someone who claims to have studied remote sensing would know better, and you do not.
His chart is a lie as it is from PIOMAS.
Here is one from MASIE and SII in a single chart, the two best data sets:
PIOMAS is a model that uses some datasets (I did not check which ones). I am guessing some vital data did not exist pre 1979.
All you do is guess, Ms Terak, because you have no clue as to what you are speaking of. Clearly you do not know squat about remote sensing.
“PIOMAS is a model …”
And so we ask, what validation was done on this model to ensure it represents real-world truth? From the looks of it, none, since it is too convenient to quote PIOMAS instead to real data.
POIMAS gives nice, safe, confirmation of warmist beliefs. The real data is scary disproof.
Science!
That’s a bad model. This is science.
You are showing the urban heat island effect.
…so do you think the Urban Heat Island – effect is melting land-ice and sea-ice plus raising and heating the oceans?
That is the result of our current interglacial. You should try studying interglacials, and learn why ice melts.
This interglacial had been cooling for several thousands of years until the onset of industrialisation.
Interglacials, like the rest of our climate, is not a linear function.
Ice melts at 33F, as well as 40F. See if you can figure out what I am telling you.
Ms Terak, Tony’s chart is a simplistic visual, no models were used. Your chart, however, is badly modeled and uses anomalies which have no place in global climate.
Which are the “approved’ historical reconstructions? None would imply a serious case of denialism…
I have never denied natural variability. I am on the side of the science Ms Terak and would never deny it, you are the know-nothing that keeps making false claims and keeps getting schooled.
Are the approved temperature reconstructions are? Am I hearing crickets…?
Are the approved temperature reconstructions are?
A matter of opinion.
Now that I have answered your question, it is your turn…
1- List all climate forcings, order them from most to least effectual, and then quantify them all.
2- Please provide even one peer reviewed paper that refutes natural variability as the cause of recent, or any, global climate changes.
There is nothing unusual or unprecedented about our climate, or how we got here. For 4,500,000,000 years climates have always changed, naturally. This means there has been a set precedent, and the burden of proof falls on natural climate change deniers like yourself.
Please note that an acceptable temerature reconstructions does not exist. Textbook denialism. You can bet same applies to satellite altimetry etc. The Earth is not warming if one denies all the evidence :)
Please note that Ms Terak is still avoiding my questions, and continues to blather on about data fraud. She still does not get that natural variability has never been disproven, and that there is absolutely nothing unusual or unprecedented about our climate.
Of course climates change!
terak – that is simply a graph. The “science” is in the “temperature reconstruction” and given the fact that they are using the “Temperature Anomaly” on the Y-axis over an X-axis that stretches out over 1000 years, ought to give one pause. Use of “anomaly” in that type of graph/calculation REQUIRES a fundamental PRESUPPOSITION. Do you know what that presupposition is? _____________. If you do, I will give some credence as to what you are posting, but my guess is that you do not.
Waiting for an answer… In order to validly use “temperature anomaly”, what fundamental presupposition are you required to make ________________. (Hint: it is actually built into the anomaly calculation.)
Read this article and compare the unaltered data from 1800, to the chart you posted. It gives a great explanation of the problems with the data recently. The difference between the Maine temperatures posted by NOAA pre 2013 and post 2013 is very revealing.
https://wattsupwiththat.com/2014/06/28/the-scientific-method-is-at-work-on-the-ushcn-temperature-data-set/
There appears to be no published critique of the temperature time-series. Denialists are either lazy, incompetent or both. That makes me think that their critique is based on so many misunderstandings that it would never get published, so why bother trying?
The only denialists are those that deny that our climate changes naturally. To the Ms Terak’s of the world, CAGW is religion.
http://wattsupwiththat.files.wordpress.com/2012/10/gwma-002_op_987x740.jpg
http://www.greenworldtrust.org.uk/Science/Images/Main/Warm_periods.jpg
Thanks for those graphs. The second one is particularly illuminating. There is a regular pattern to the warm periods and the modern warm period is bang on time, therefore natural. QED.
Tony,
Thanks, I wanted to re-post this graph in my comment above. A perfect example of the limitations of semi-empirical modeling. If we take any sloped segment of that sine wave and discard the other pieces, we can construct a semi-empirical model that will show a cooling or warming trend. If we then extrapolate those trends, our conclusions will be that the Earth is heading into another Ice Age or will look like the planet Venus in a few years.
As I stated above, this is what the politicians and policy makers want. And the fact that semi-empirical models have a “shelf life”, before they are revealed to be erroneous, is why the Obama Administration was trying to silence dissenters and declare the scientific debate over (97% consensus Media push.)
All of this is UNETHICAL, DISHONEST and frankly, BAD SCIENCE (to put it mildly).
Terak is showing a bogus graphic, using two disparate T records spliced on to proxy records incapable of less then 100 year to 300 resolution. ( scientifically meaningless)
PIOMAS shows a >50% reduction in minimum arctic ice volume from 2003 to 2017. DMI shows the 2003 and 2017 minimums were about the same. Given the task difficulty and lack of confidence intervals, I doubt either one is “right”.
PIOMAS and CryoSat-2 agree pretty well. The DMI-model is not as good as PIOMAS.
Do CryoSat-2 based arctic ice volume estimates agree with DMI and/or PIOMAS for 2003?
(OT) And more Free dom. Who would have said F.CK Obama without fear for his or her or its future ?
Robert de Niro’s ‘Fuck Trump’ speech at Tony awards
https://youtu.be/1zNr8Pf1QkY
Hansen is just another bullshitter in a long bullshitting era of doom&gloom
“scientists” since the Malthusian Nightmare was announced in 1798.
As 2007 was then a record low (and is still second lowest) all predictions made on the basis of it in 2008 assumed that melt seasons would continue as in 2007.
also, showing the 2008 thickness/extent against 2018 is distortion, seeing as 2007 was such an exceptional year.
the ice is however in a worse condition than in 2007, so a similar melt season would surely result in a new record.
I think it is meaningless to throw out assertions like ‘melting at a record slow rate’ without some attempt to explain what that means in terms of ice trends -and why.
There can’t be any basis for using that to say the ice is recovering or warming has stopped. Not given other ice related indicators.
Funny how you do not think assertions like, “As 2007 was then a record low (and is still second lowest)”, are meaningless. But only funny if you are not starving to death.
Inductively challenged.
Terak’s and Grief’s (no typo) excuse making and apologia remind me of my nieces…problem is, they’re eight years old.
Well, at least griff and terak do give illustrative support for the validity of the Dunning-Kruger Effect.
FAILED PREDICTIONS
Data griff, WHY do you ALWAYS remain IGNORANT !!
Melt volume over the last 14 or so years
These are people on Xanax, wringing their hands over everything. Go outside, get involved in your community, tutor some kids, volunteer somewhere. Average people aren’t buying this. Plus, I thought there were benefits to having less ice
It would make no difference whatsoever if the Arctic completely melted, and would actually be a good thing for shipping (and the environment, in that travel distance would be greatly reduced for shipping).
It is unclear what effect a total Greenland melt would be since the interior of Greenland is a big bowl, much of the water would never make it to the oceans. But, since it would take approximately 1200 years to completely melt with an average temperature of 80F … we aren’t going to be able to see it in our lifetimes, no matter how hot it gets. In terms of Greenland, no amount of temperature rise is going to have any effect upon us, our children, our grandchildren, our great grandchildren, our great great grandchildren .. etc.. etc..
This is why I laugh at morons like Griff and Terak. They are simply too stupid to do simple mathematics. They can bloviate all they want about doom and gloom, but what they miss is, it is impossible to get from here to there. I just laugh my ass off… morons…
Industrialisation started at the onset of warming. Not the other way round.
Tony:
You misspelled prophet, it’s P-R-O-F-I-T.
:)