
For the past decade or so, I have been documenting how US temperature graphs released by NOAA and NASA are not representative of their own raw data. This work has been high profile on a number of occasions, but has been repeatedly censored by the press as “conspiracy theory.” This happened as recently as yesterday on DailyKos.
Reality is that the data alterations are no secret, and that NOAA and NASA acknowledge that they do it. In this post I will document the magnitude of the adjustments and how they can be visualized.
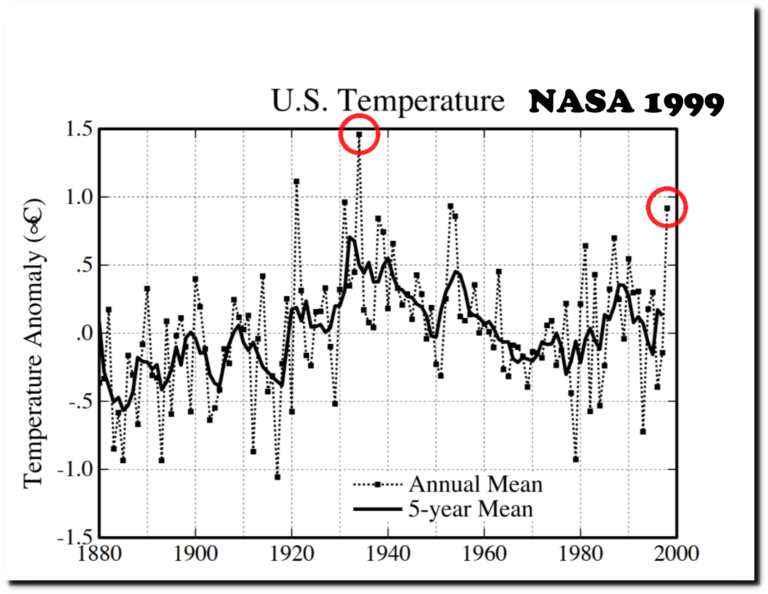
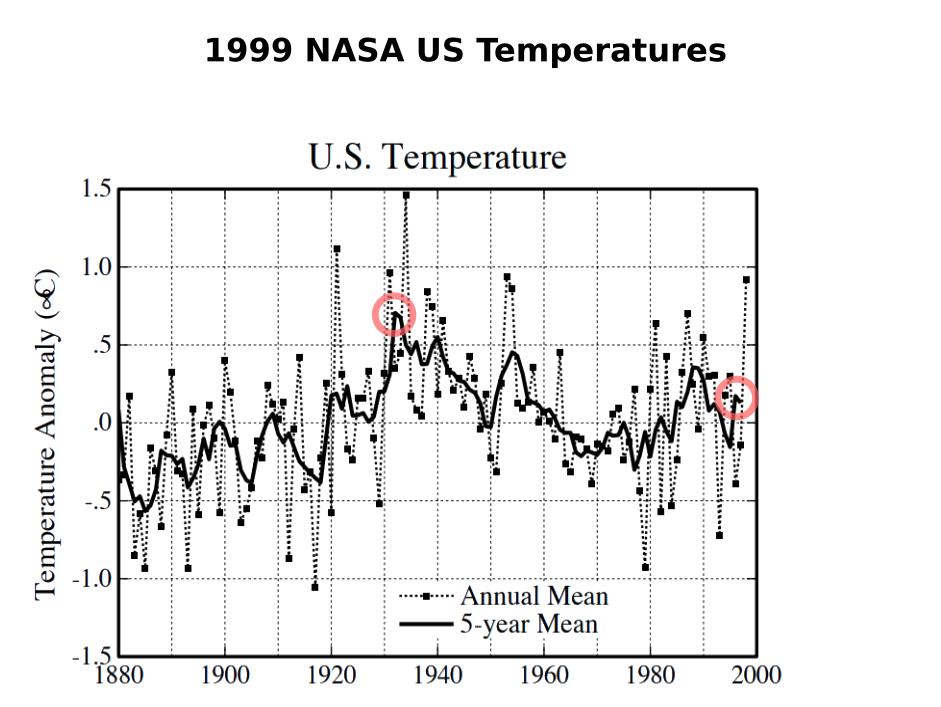
This graph of US temperatures was posted by NASA in 1999, showing a strong cooling trend from the 1930’s through the end of the century. The years 1934 and 1998 are circled.
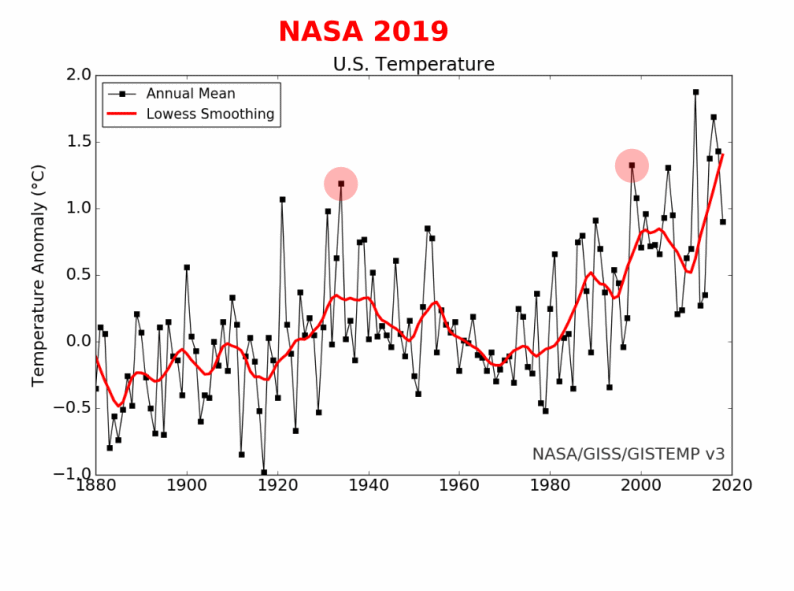
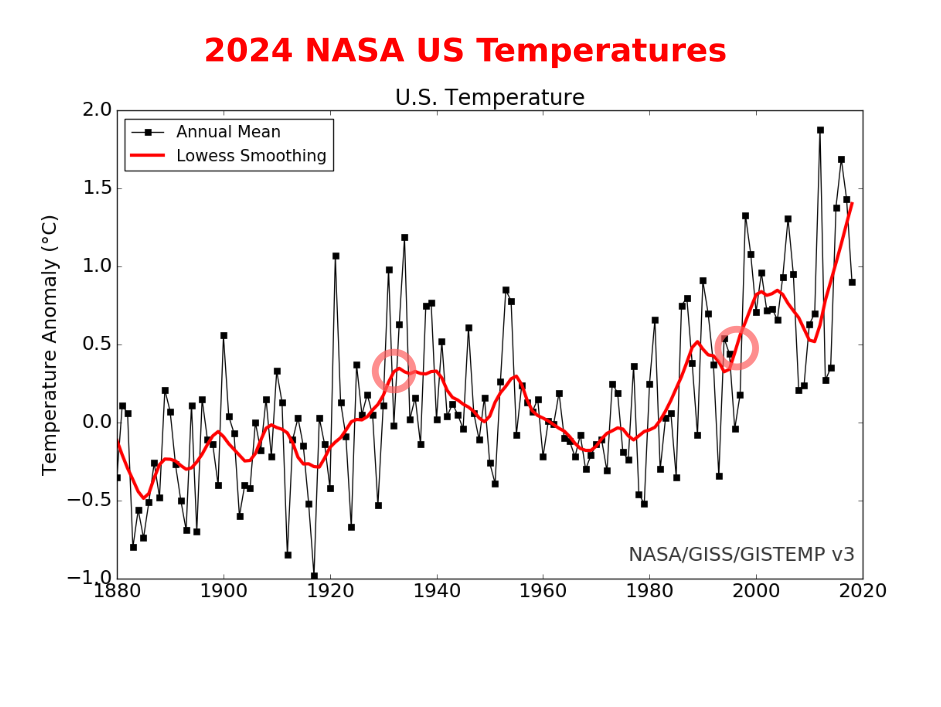
And this is NASA’s current graph, which now shows a strong warming trend during that period.
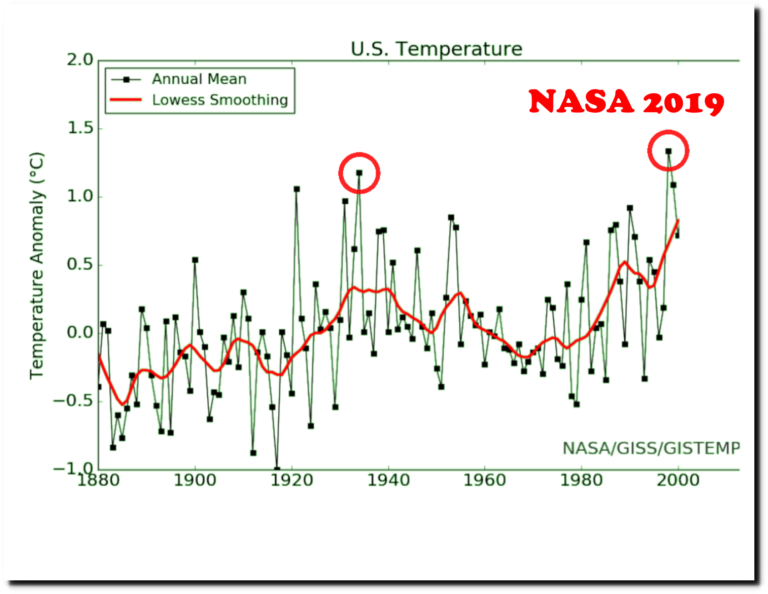
Here is an animation showing how the data has been altered over the past 20 years.

A 2001 paper by NASA’s James Hansen and NOAA’s Tom Karl showed less tampering.
Surface Temperature Change: A Closer Look at United States Cooling, Urban Effects and Krakatau
It is more difficult to locate historical NOAA graphs, because they are generated dynamically and are not archived on the Internet. One example I can document is Texas. The graph below is NOAA’s current 1895-2010 graph for Texas, which shows a strong warming trend.
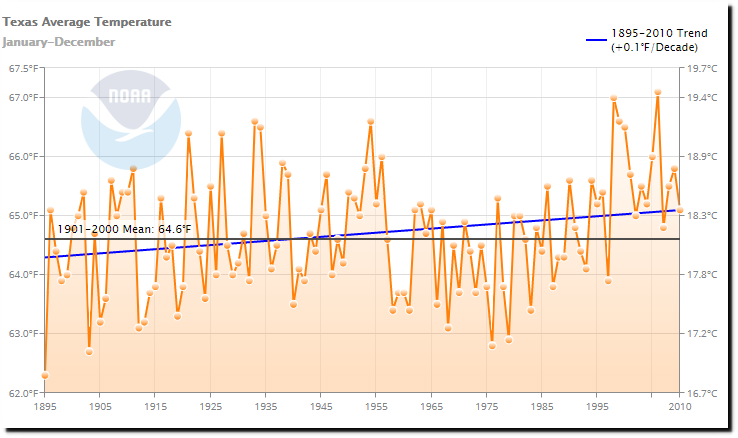
Climate at a Glance | National Centers for Environmental Information (NCEI)
Anthony Watts captured the same graph in 2012, and it showed no warming.
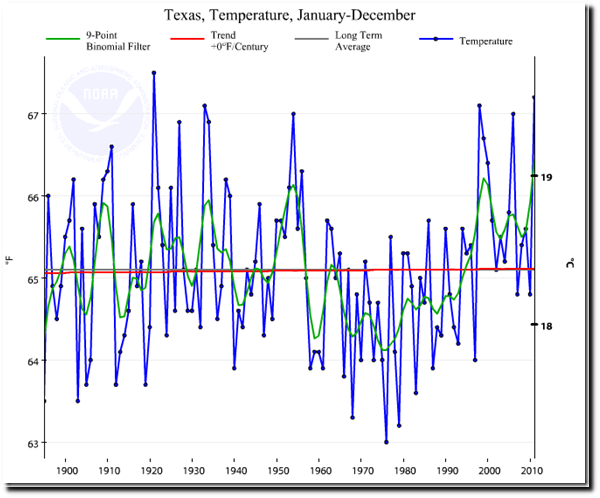
Climate scientists who have been claiming Texas is warming are totally wrong. | Watts Up With That?
And this graph showing no warming was posted by the San Antonio Express News in 2012.
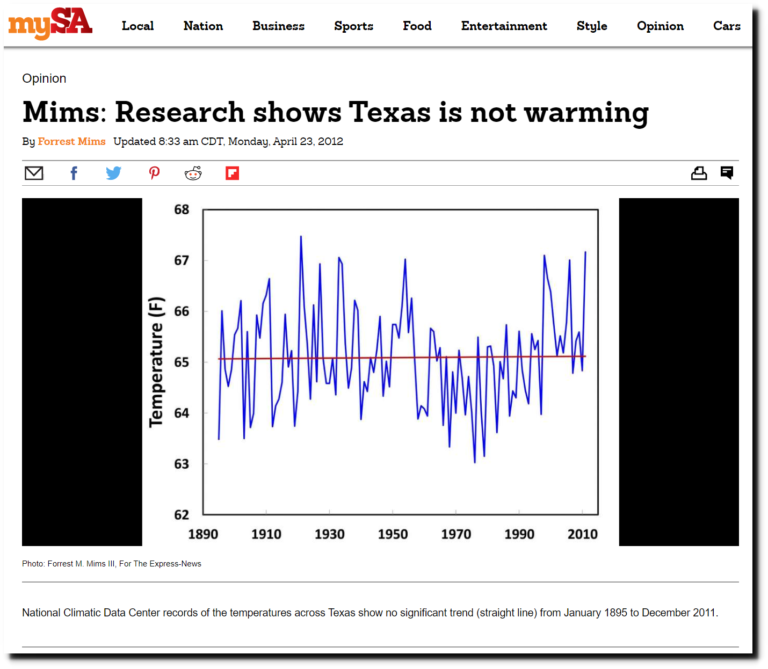
Mims: Research shows Texas is not warming – San Antonio Express-News
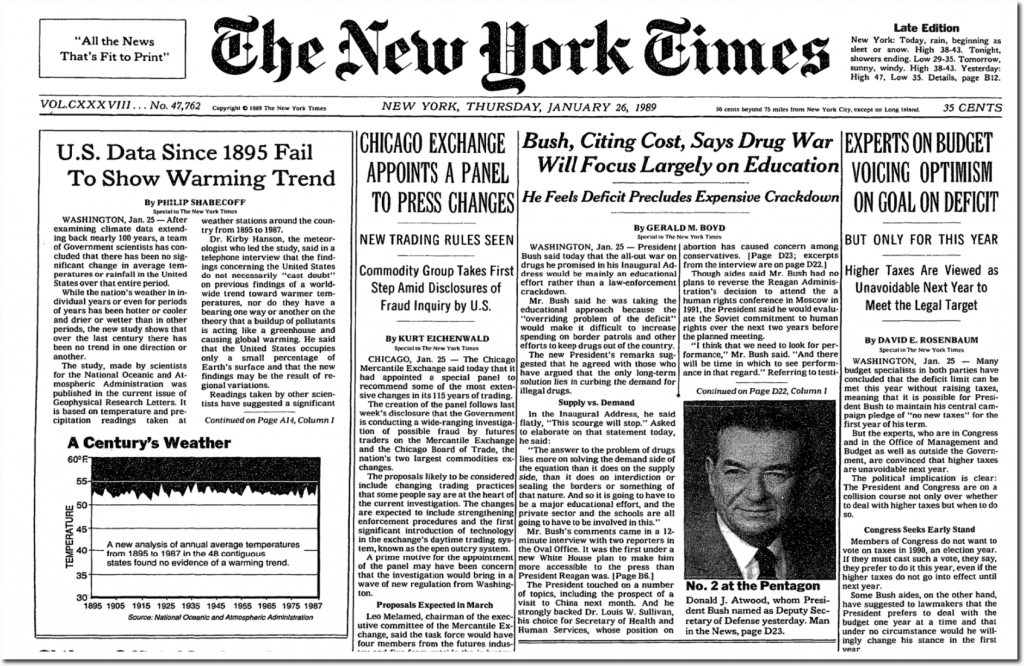
On January 26, 1989 the New York Times ran this headline : “US Data Since 1895 Fail To Show Warming Trend”
After examining climate data extending back nearly 100 years, a team of Government scientists has concluded that there has been no significant change in average temperatures or rainfall in the United States over that entire period.
While the nation’s weather in individual years or even for periods of years has been hotter or cooler and drier or wetter than in other periods, the new study shows that over the last century there has been no trend in one direction or another.
The study, made by scientists for the National Oceanic and Atmospheric Administration was published in the current issue of Geophysical Research Letters. It is based on temperature and precipitation readings taken at weather stations around the country from 1895 to 1987.
U.S. Data Since 1895 Fail To Show Warming Trend – NYTimes.com
Now NOAA shows lots of warming from 1895 to 1988.
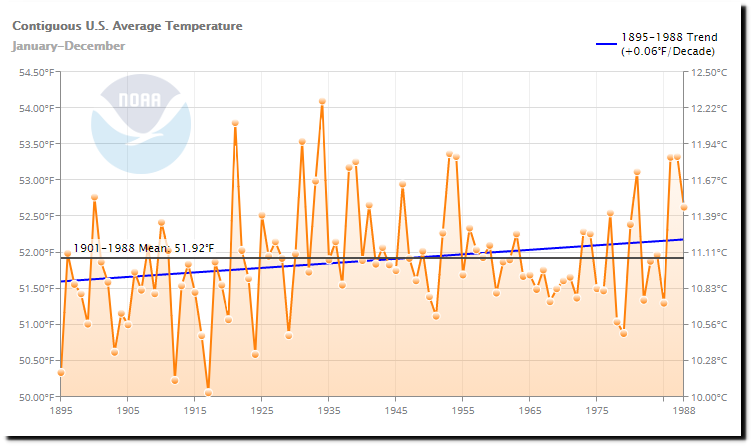
Climate at a Glance | National Centers for Environmental Information (NCEI)
There is no question that the US temperature record has been altered over time. Additionally, the National Climate Assessment shows that summer temperatures were much hotter in the US ninety years ago, which is not consistent with current NOAA graphs.

Temperature Changes in the United States – Climate Science Special Report
The US temperature is very important, because the vast majority of stations which NOAA has long-term daily temperature data for are located in the US.
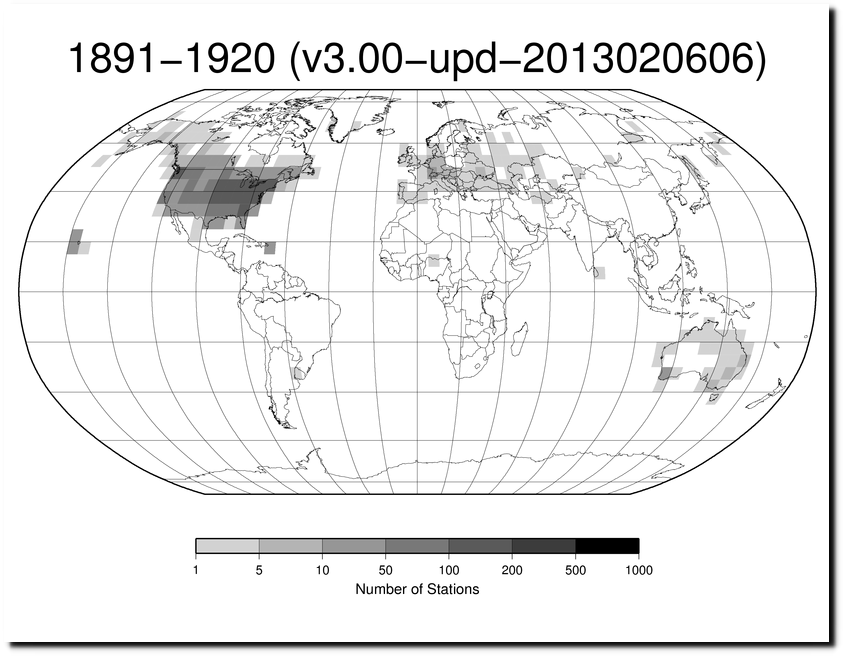
ftp://ftp.ncdc.noaa.gov/pub/data/ghcn/daily/figures/station-counts-1891-1920-temp.png
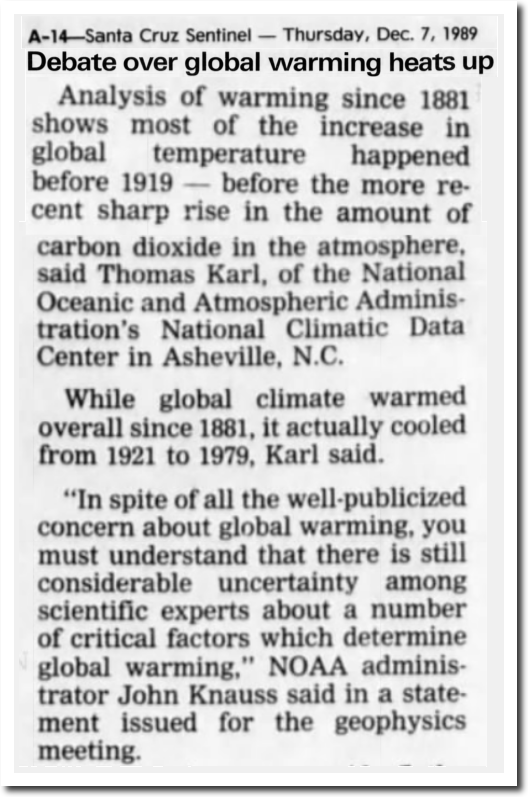
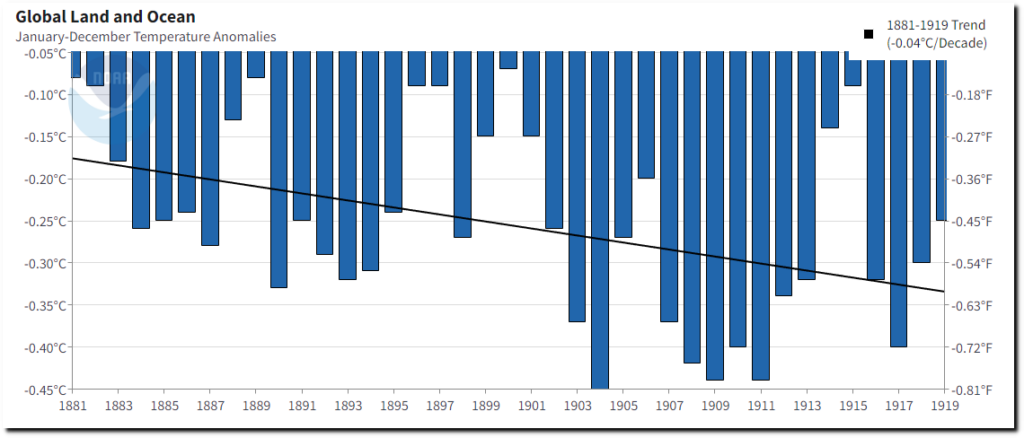
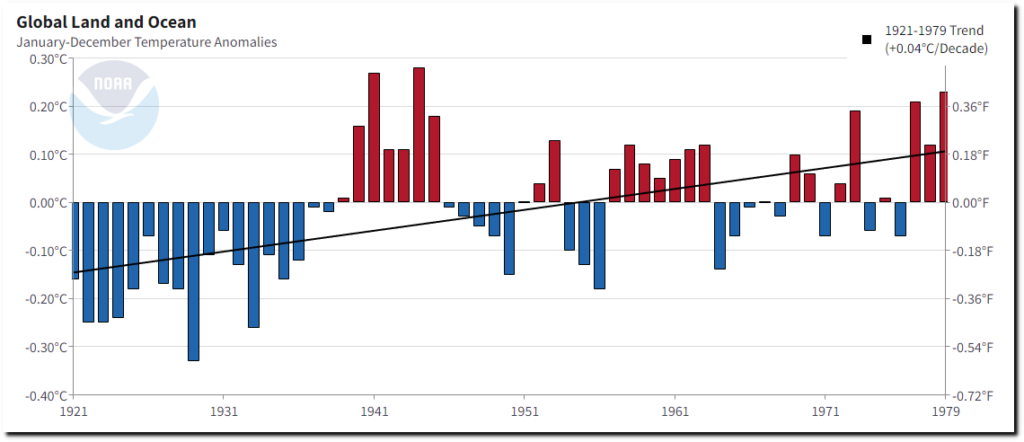
The global temperature record has seen similar data alterations. In 1989, Tom Karl at NOAA said earth had cooled from 1921 to 1979.
Analysis of warming since 1881 shows most of the increase in global temperature happened before 1919 — before the more re-cent sharp rise in the amount of carbon dioxide in the atmosphere. said Thomas Karl, of the National Oceanic and Atmospheric Administrations National Climatic Data Center in Asheville, N.C.
While global climate warmed overall since 1881, it actually cooled from 1921 to 1979, Karl said.
“In spite of all the well-publicized concern about global warming, you must understand that there is still considerable uncertainty among scientific experts about a number of critical factors which determine global warming,” NOAA administrator John Knauss said in a statement issued for the geophysics meeting.
07 Dec 1989, Page 14 – Santa Cruz Sentinel at Newspapers.com
NOAA now shows a strong warming trend during that period.
Climate at a Glance | National Centers for Environmental Information (NCEI)
Climate at a Glance | National Centers for Environmental Information (NCEI)
There is no question the data has been altered. Now let’s look at the alterations being made to the US temperature record. This is the current NOAA US temperature graph for average temperature. It shows a strong warming trend since 1895.
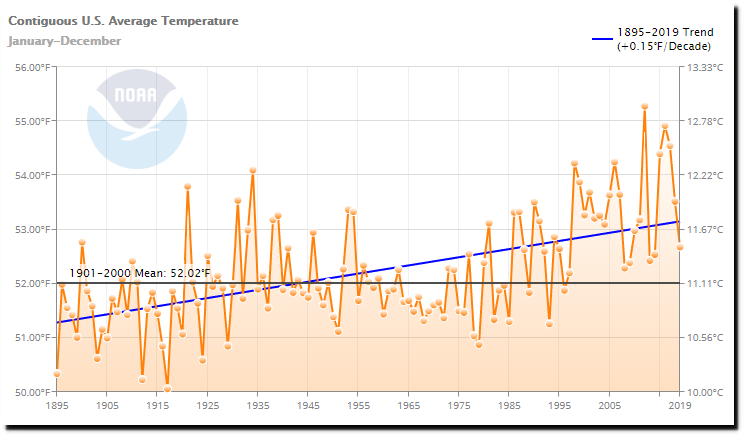
Climate at a Glance | National Centers for Environmental Information (NCEI)
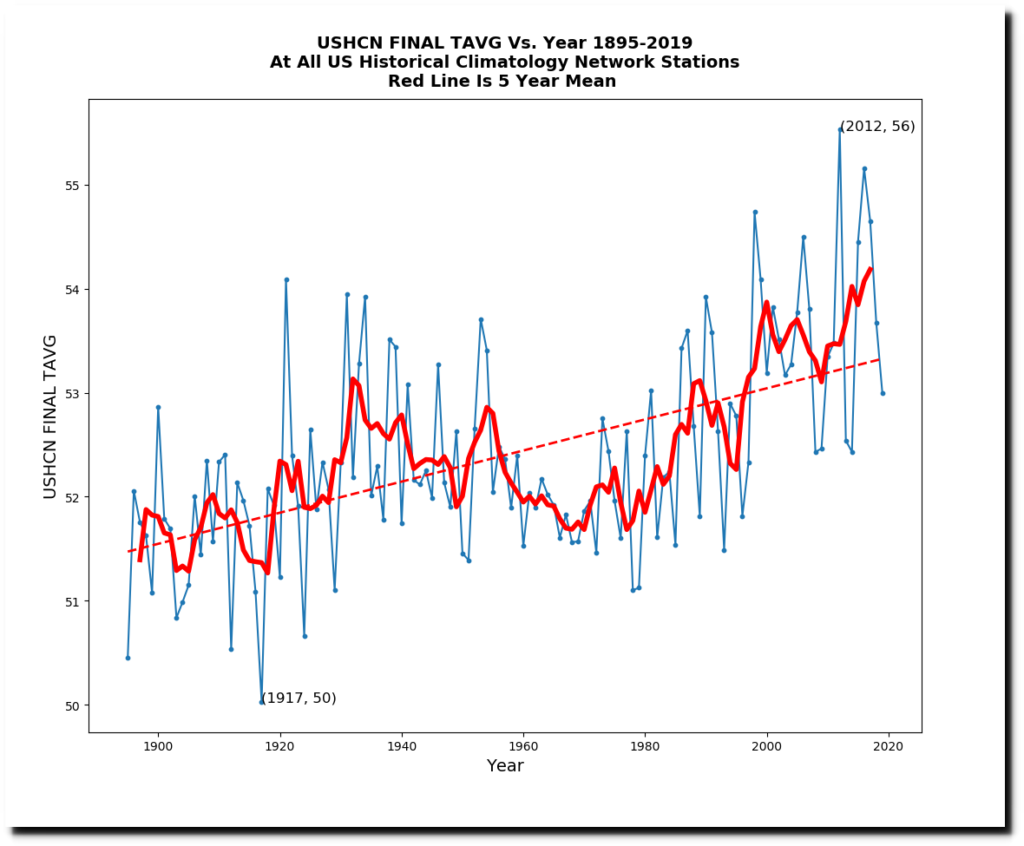
I can reproduce this graph fairly closely by taking a simple mathematical average of the NOAA United States Historical Climatology Network “final” (adjusted) monthly data set, which is available at this link. The software I wrote to calculate and generate this graph is open source and is being used by hundreds of people.
Here is the current NOAA US temperature graph for average maximum temperature. It also shows a strong warming trend since 1895.
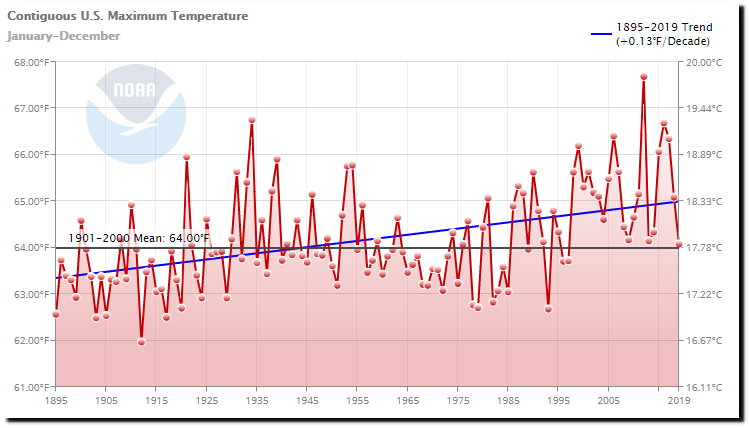
Climate at a Glance | National Centers for Environmental Information (NCEI)
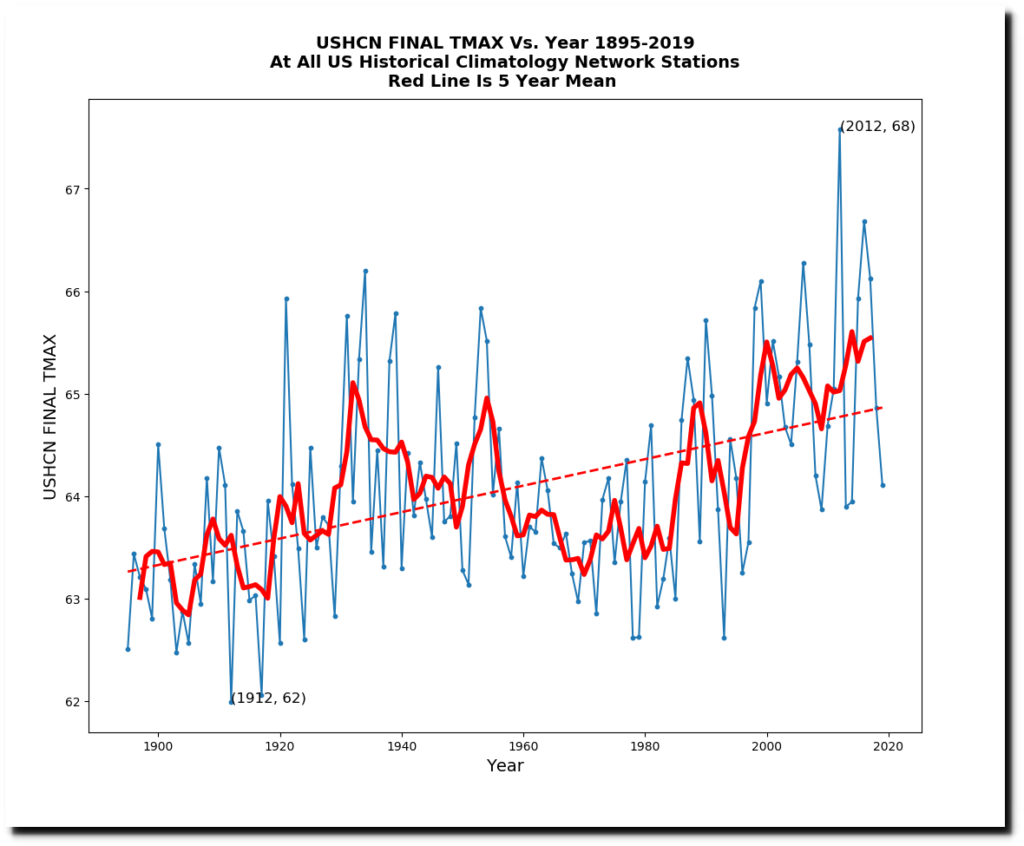
I can closely reproduce that graph by taking the numerical average of the NOAA United States Historical Climatology Network “final” (adjusted) monthly data set, which is available at this link. It shows a strong warming trend and recent years much warmer than the 1930s.
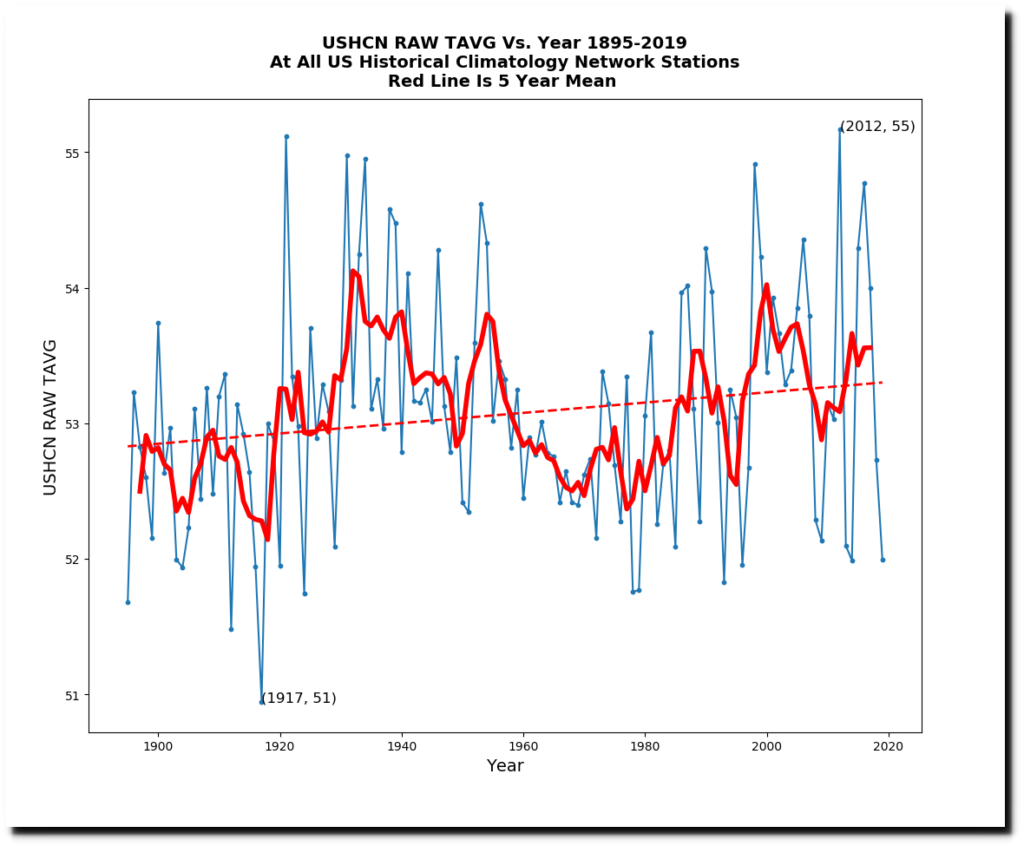
NOAA also provides the raw (unadjusted) monthly temperature data. For average temperature, it is available at this link. The unadjusted raw monthly graph shows much less warming than the adjusted data, and has recent years cooler than the 1930s.
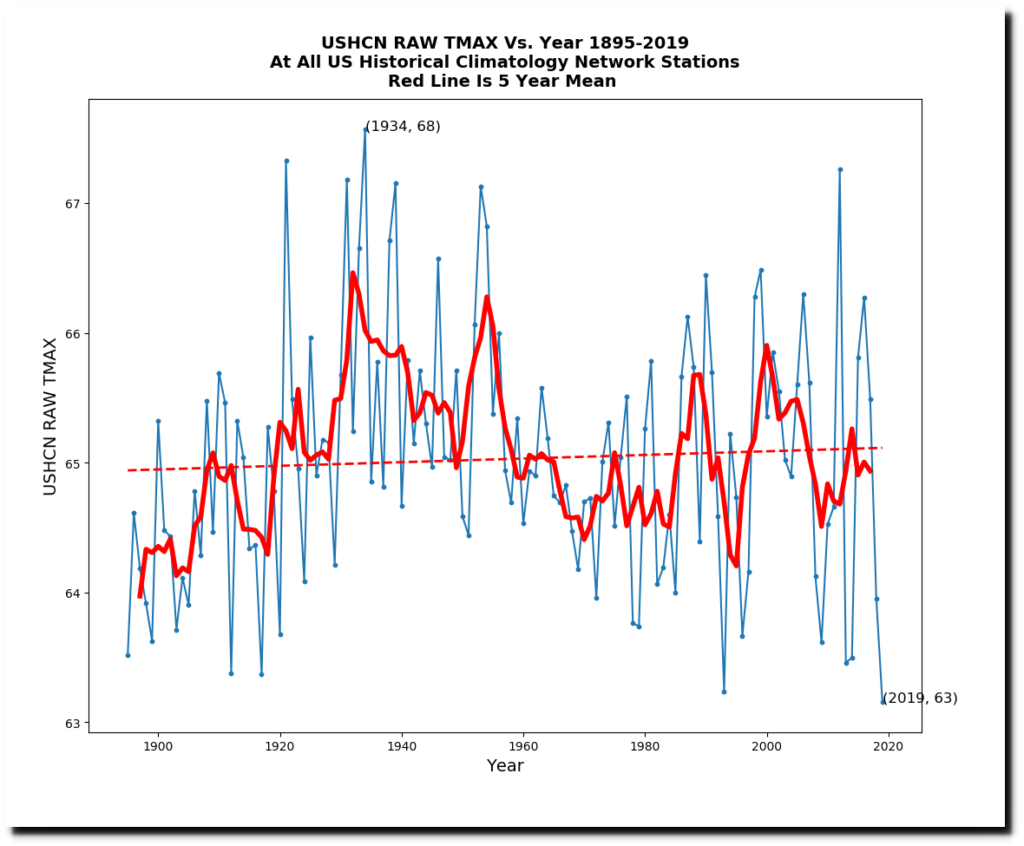
The unadjusted average maximum temperature is available at this link. The unadjusted raw monthly graph shows much less warming than the adjusted data, and has recent years much cooler than the 1930s.
The NOAA unadjusted monthly temperature data, also closely matches the NOAA daily temperature data, which is available at this link. The graphs below show daily average and maximum temperatures.


The graph below plots unadjusted monthly average temperature vs. daily temperatures, with excellent correlation.
And this is the same graph for monthly unadjusted maximum temperatures vs. daily maximum temperatures. Again, the correlation is very good.

Also note that the frequency of hot days in the US has plummeted. The graph below plots the frequency of 95F (35C) days vs. year, and shows that there has been much less hot weather in the US over the past 60 years compared to the period from 1910 to 1960.

This correlates well with the graphs from the National Climate Assessment.
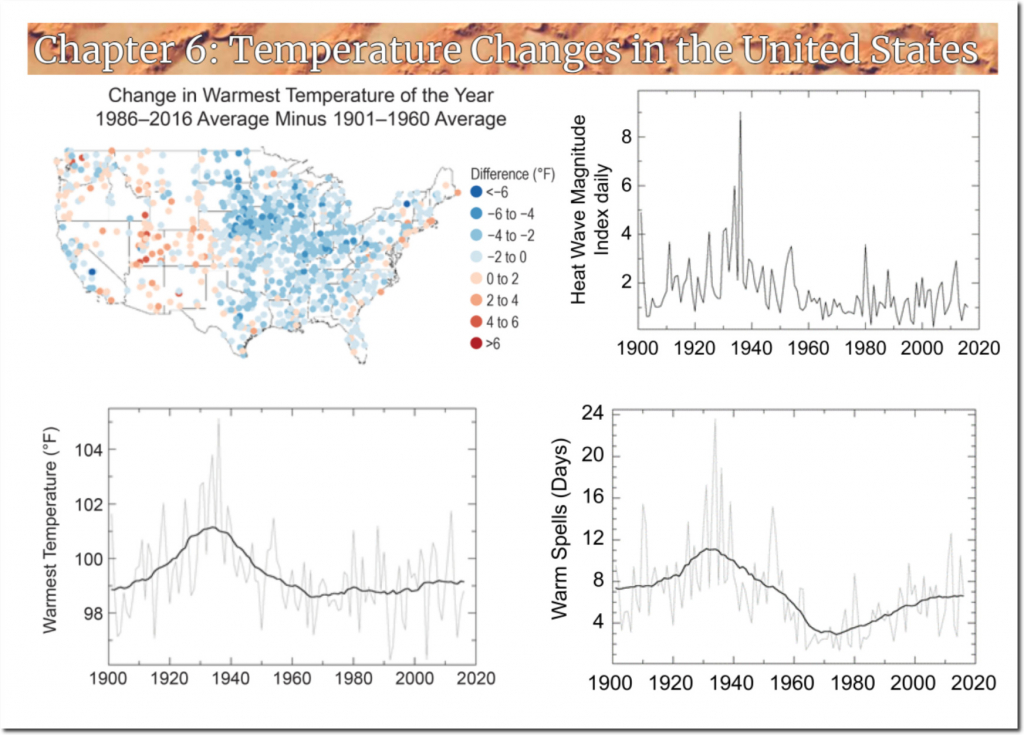
Temperature Changes in the United States – Climate Science Special Report
Now let’s get into the interesting part, comparing monthly adjusted (final) average temperature vs. unadjusted (raw) average temperature. This next graph shows the difference between the average adjusted and unadjusted temperatures – i.e. the adjustments. It shows a hockey stick of data alterations, with older temperatures cooled by about one degree (F) and recent temperatures warmed by about one degree.

And the next graph is the smoking gun of something amiss. It plots the adjustments vs. atmospheric CO2. It shows a very close correlation between NOAA US temperature adjustments and CO2.

And here is a more detailed view, showing extremely good correlation between the adjustments and CO2. The next graph includes data for the first nine months of 2020, and has an R² of 0.981.

The implication of this is that the huge adjustments being made to the US temperature record are being made to match global warming theory, which is the exact opposite of how science should be done. The unadjusted data shows essentially no correlation between CO2 and temperature.

In the next blog post I will analyze what I can deduce about the very poorly documented NOAA temperature adjustments, and what questions they need to be asked.
