
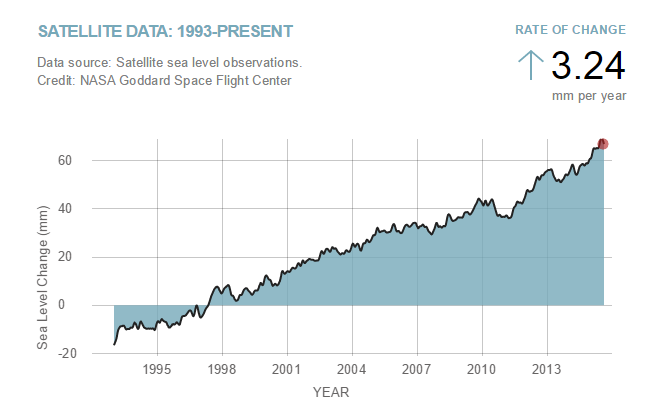
NASA shows 3.24 mm/year sea level rise on their web site. They call it “Facts” – when in fact it is blatant fraud.


Until early December 2015, NOAA had this web page up showing about half that much sea level rise. NOAA just made it disappear ahead of COP 21.
the absolute global sea level rise is believed to be 1.7-1.8 millimeters/year.

Here is the web archive link from September 10, 2015
September 10, 2015 : Sea Level Trends – Global Regional Trends
So let’s look at how NASA committed their fraud. The first thing they did was to add in a 0.3 mm/year “Global Isostatic Adjustment” (GIA) to their satellite data. This is a completely fraudulent adjustment based on theoretical sea floor sinking – which should be used to calculate the sea floor height, not the sea surface height. Even if sea surface height rise was dead zero, the GIA adjustment would show sea surface height increasing by 0.3 mm/year. Mind-blowing malfeasance.
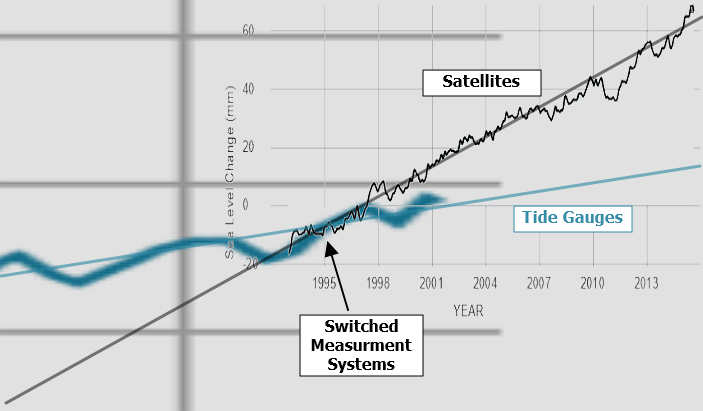
The next fraud was bait and switch. Until 1993, they use tide gauges, but after 1993 they switched to satellites.
This change in instrumentation to uncalibrated satellites produced an immediate doubling of sea level rise rates. Tide gauges do not show any change after 1993. They are attempting to blame an instrumentation change on climate change. Once again, mind-blowing malfeasance.
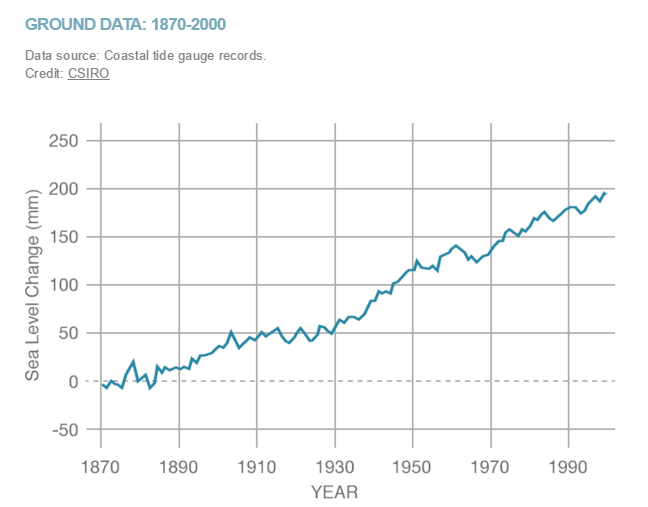
But it gets much worse. Their tide gauge data is also fraudulent, and does not agree with any historical publications, or current NOAA tide gauge data.
pubs.giss.nasa.gov/docs/1982/1982_Gornitz_etal_1.pdf
pubs.giss.nasa.gov/docs/1983/1983_Hansen_etal_2.pdf
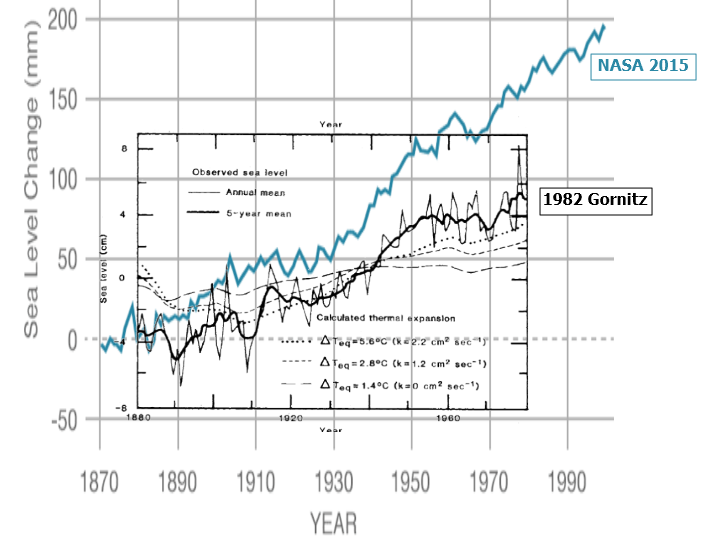
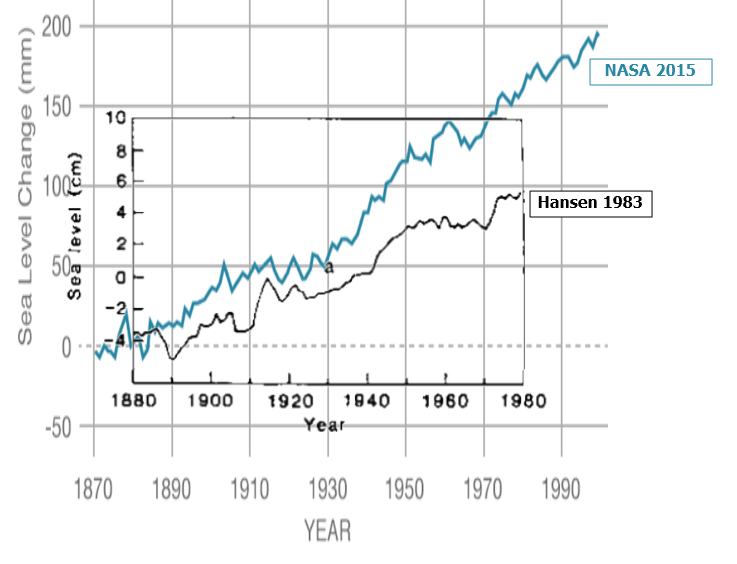
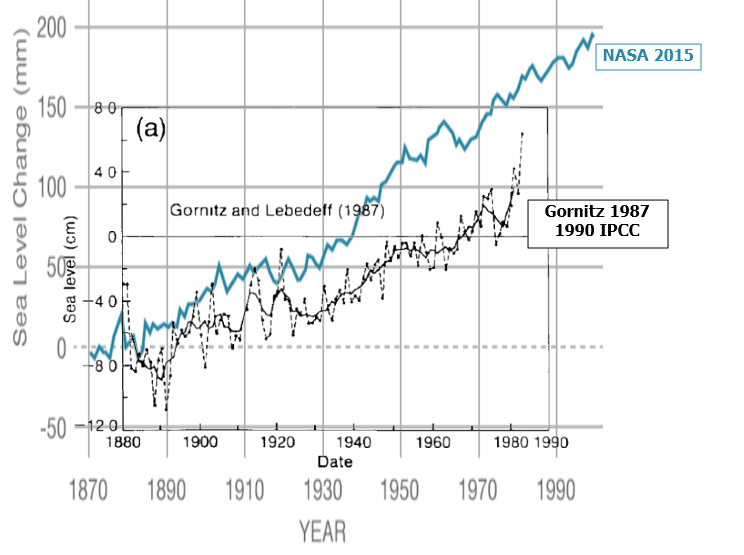
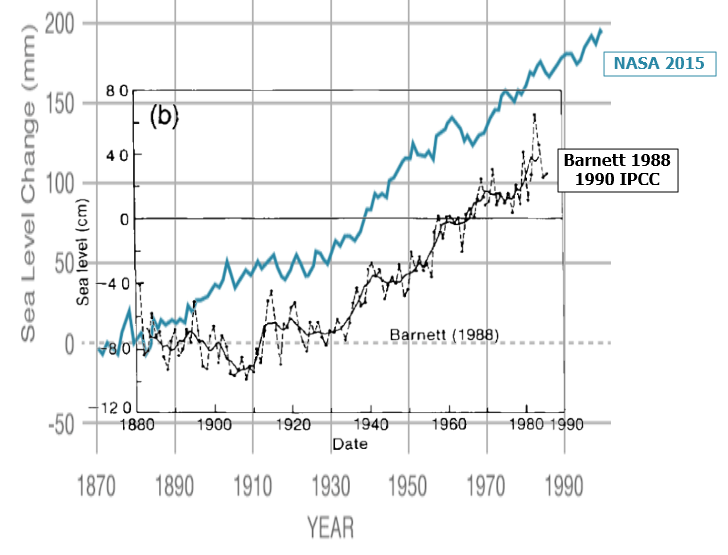
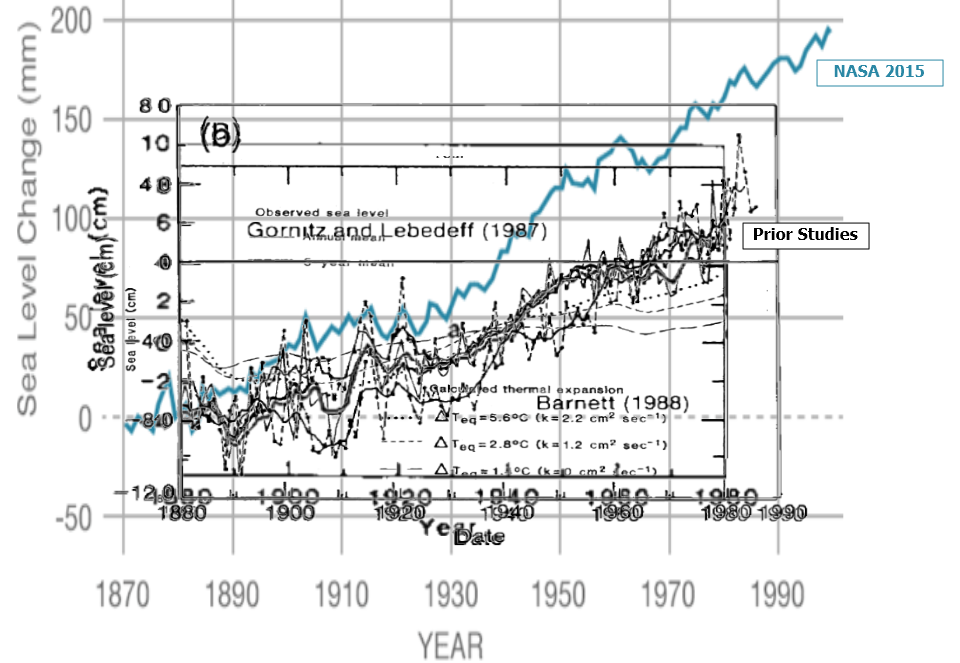
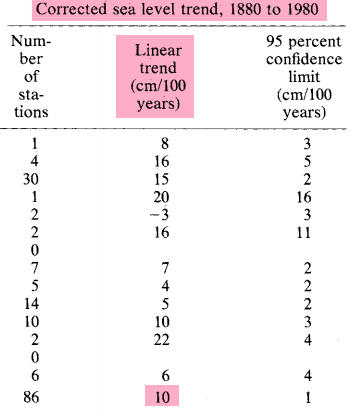
The composite below shows all of the above in one graph. Earlier studies consistently showed half the rate of 1880 to 1980 sea level rise, as NASA shows now.
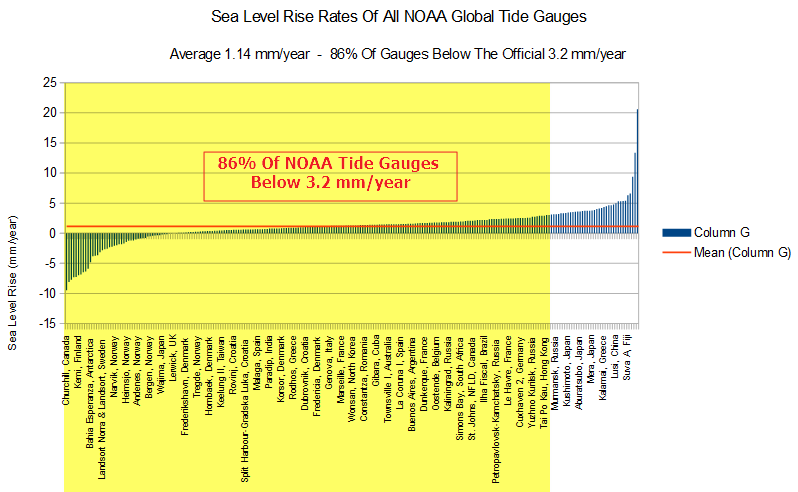
NOAA has 240 tide gauges globally, and 86% of them show less sea level rise than the claimed average of 3.2 mm/year. The average of all of the NOAA tide gauges is 1.14 mm/year, just over one third of the NOAA climate claims.
tidesandcurrents.noaa.gov/sltrends/MSL_global_trendtable.html
In 1982, NASA showed 1 mm/year. Now they claim 3.24 mm/year
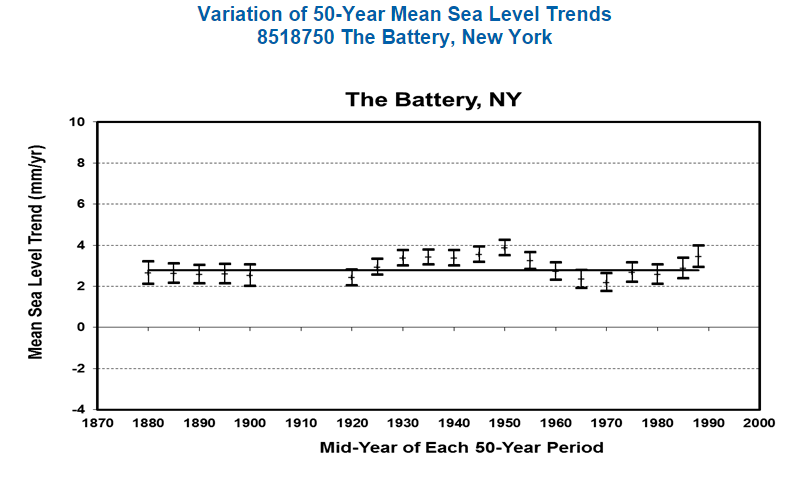
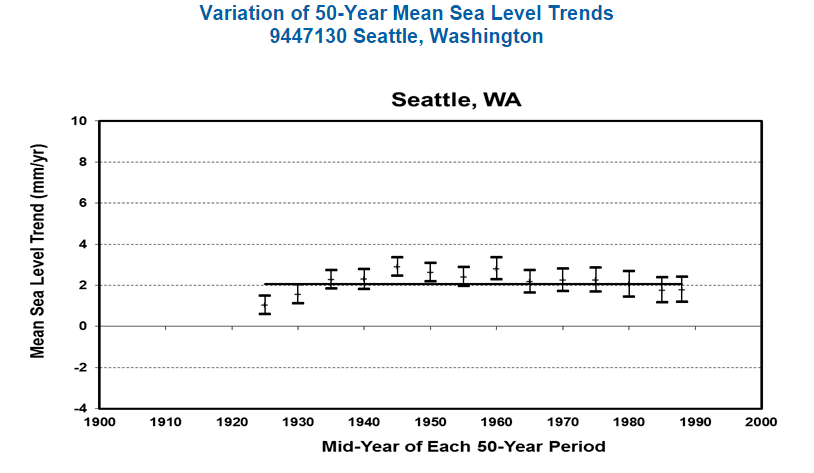
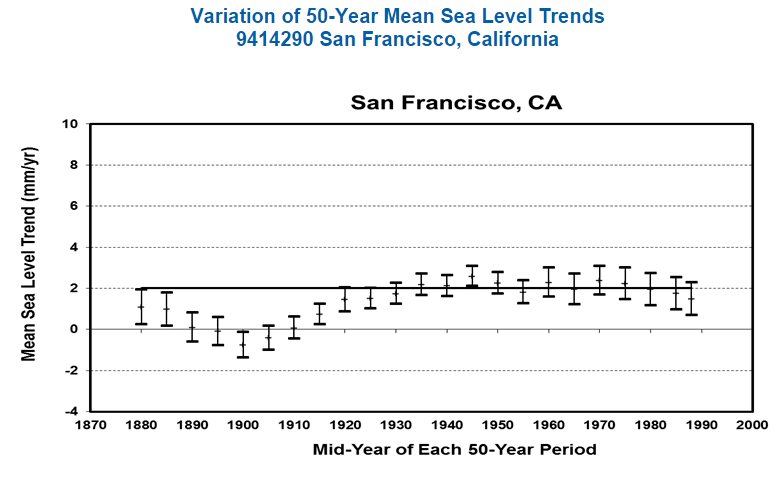
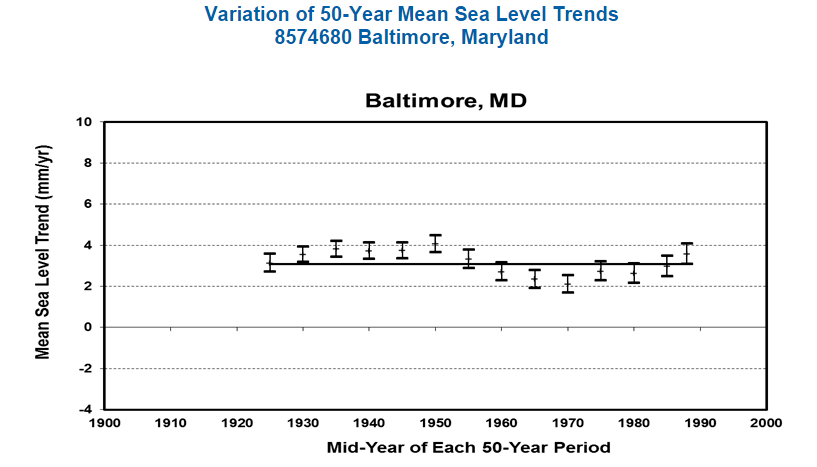
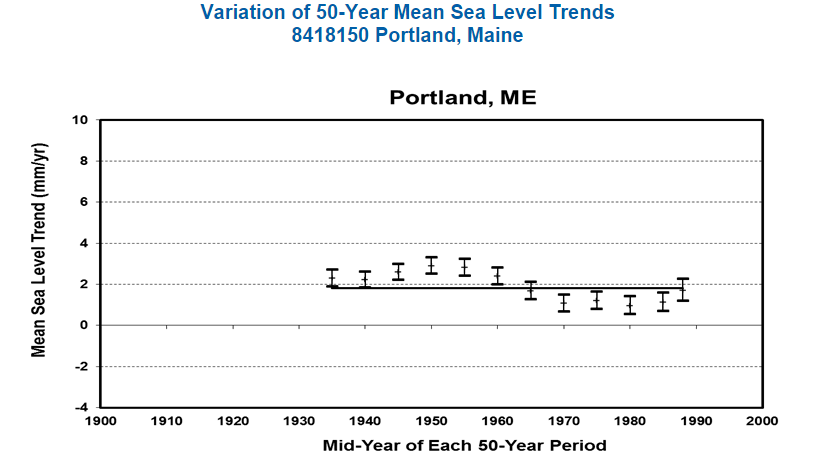
Tide gauges show that sea level rise rates peaked around 1950. The claimed increase since 1993 is completely fraudulent.
Variation of 50-Year Mean Sea Level Trends
Sea level has been rising for 20,000 years – and raise rates have slowed considerably.
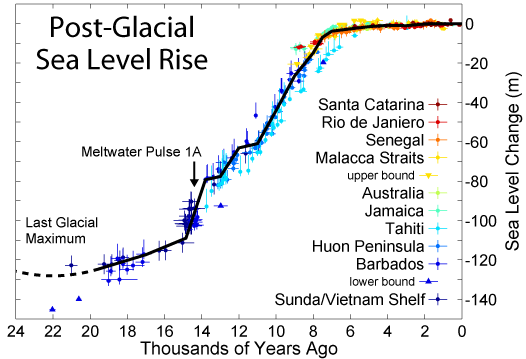
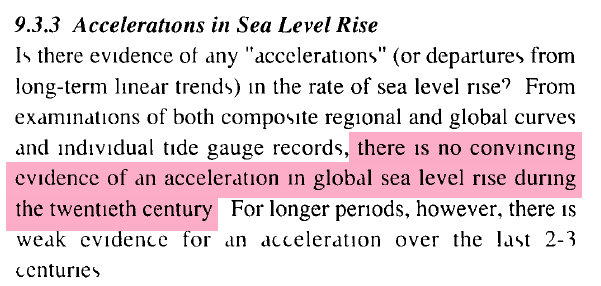
The 1990 IPCC report said there is “no convincing evidence of acceleration” during the 20th century.
Every single thing NASA says about sea level is fraudulent. NASA’s own data says that Antarctica ice growth is reducing sea level.
NASA Study: Mass Gains of Antarctic Ice Sheet Greater than Losses | NASA
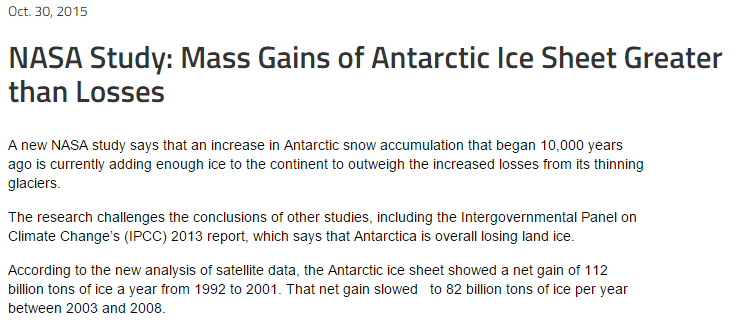
Their sea level operation is a propaganda outlet. They are not scientists and are not doing any legitimate science.
