


GISS vs Scenarios A,B and C

Global Temperature
pubs.giss.nasa.gov/docs/1988/1988_Hansen_etal.pdf

US National Debt – refresh for latest

Europe Three Day Snow Forecast


")


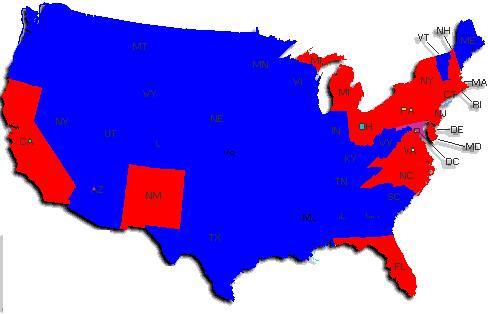
States which had their hottest year below 350 ppm shown in blue.

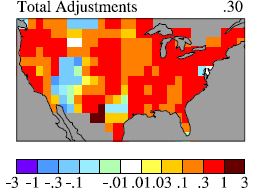
USHCN daytime adjustments

USHCN nighttime adjustments

http://en.wikipedia.org/wiki/File:Holocene_Temperature_Variations.png
http://www.globalwarmingart.com/images/1/1e/Holocene_Sea_Level.png

http://www.nhc.noaa.gov/pastdec.shtml

http://www.usatoday.com/weather/wheat7.htm

http://www.usatoday.com/weather/wcstates.htm

http://www.ncdc.noaa.gov/oa/climate/research/cag3/state.html

States which had their hottest year prior to 1970
http://www.ncdc.noaa.gov/oa/climate/research/cag3/state.html

http://sealevel.colorado.edu/current/sl_noib_global.txt
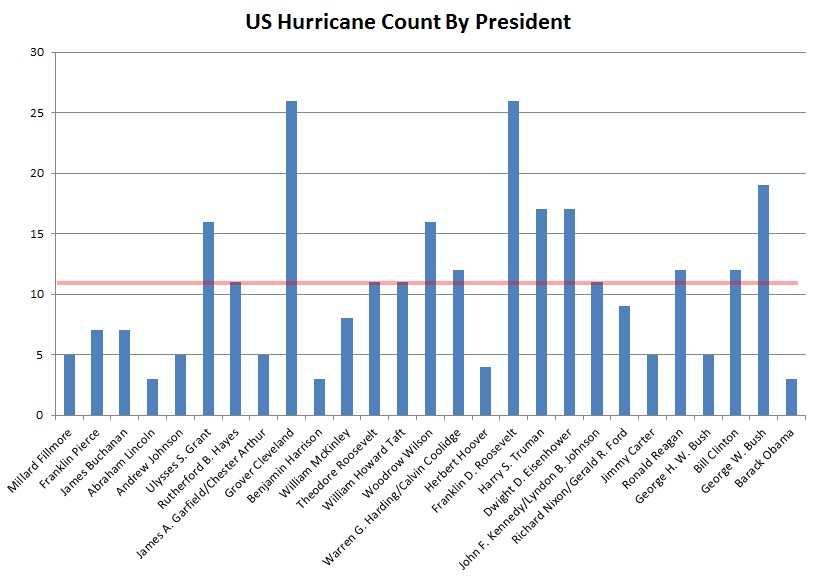
Chronological List of All Hurricanes


Pingback: New Page – Maps and Graphs | Real Science
Steven, I’ve compiled a list of Arctic sea ice maps and graphs here.
Nice, thanks!
Thanks Neven, that’s really well done
I noticed a lot of your data stops at the year 2000. Things have changed quite a bit in the last 10 years. The newest data & the past 10 years have proven clearly where were headed globally.
its now 1012 and your now using 12 year old data.
I will assume that you are a moron. When comparing against publications from 12 years ago, it is safe to assume that the publication is twelve years old.
The newest data & the past 10 years have proven clearly where were headed globally….
You think temperatures are going to remain flat forever??
Looking at the data …. A lot of things spike in 1930…. Perhaps there is a pattern as we are getting closer to 2030. But either way humans are hilarious looking at what would be considered a minute in the earths life span…. Like I agree we need to treat the earth better but we’ve only be recording the climate for what 100 years? And the earth is how old? This would be like taking someone’s temp for one second and claiming they are going to die bc their temp is 102
http://joannenova.com.au/global-warming/ice-core-graph/
What about the 800 year lags.
Curiously, so when the temperature did drop, so did CO2. They say this is because of the CO2 but the CO2 follows, so what is the mechanism of the CO2 drop as it gets colder if its not actually what it really is the decrease in biological activity due to warmer temperature with no connection to earth’s temperature?
Hi Scarlet Pumpernickel,
Regarding CO2 following temperature:
“The initial changes in temperature during this period are explained by changes in the Earth’s orbit around the sun, which affects the amount of seasonal sunlight reaching the Earth’s surface. In the case of warming, the lag between temperature and CO2 is explained as follows: as ocean temperatures rise, oceans release CO2 into the atmosphere. In turn, this release amplifies the warming trend, leading to yet more CO2 being released. In other words, increasing CO2 levels become both the cause and effect of further warming.”
I pulled this from the Skeptical Science website. Is there some aspect that does not make sense? I am happy to clarify as needed.
Best regards,
Don
The radiative balance impact of additional CO2 is much, much lower than the impact of additional H2O.
The radiative impact of CO2 in comparison to H2O is minute and so is its direct affects on the global temperature.
The Earth’s climate to which we are so accustomed however, is a delicate balance; an ebb and flow of heat on a planetary scale made possible by the atmosphere (jet stream, etc.) and powered by the oceanic currents. A good analogy would be that the atmosphere is the engine and the oceans are the batteries (climate is an Eco-friendly system and runs on batteries not gas, :-))
The minute affect of CO2 (only a couple of degrees increase a year) is most felt in the polar regions, causing rapid polar ice melt down, which will in turn affect the oceanic currents in several ways(reduced salinity, Circumpolar Current, etc.)
The change in temperature doesn’t need to be huge for it to have an impact on the climate.
If the halocline, the current that in essence keeps the Antarctic ice from melting, should change in any way it will more than likely cause dramatic changes in the climate….
Unlike other planetary processes which happen on a geologic time-scale , the climate change will be rapid and could very well reshape the map of our planet’s climate within a decade or two.
And this excerpt from: U.S. Climate Action Report 2000, US Environmental Protection Agency, page 38.
“Although estimates of the contribution from water vapor vary widely, most sources place it between 90 and 95% of the warming effect, or about 30-31 of the 33 degrees . Carbon dioxide, although present in much lower concentrations than water, absorbs more infrared radiation than water on a per-molecule basis and contributes about 84% of the total non-water greenhouse gas equivalents , or about 4.2-8.4% of the total greenhouse gas effect.”
In other words, increasing CO2 levels become both the cause and effect of further warming.”
====
Don, global warming theory says that a slight increase in temp…causes a rise in humidity…which cause another rise in temp……wash rinse repeat
It was run away global humidity that causes it…
Have you even heard anything so pathetically stupid in your entire life?
Wow! It is unbearably hot and dry in South Texas. But here’s the news flash. It has been this hot and dry (or worse) here at least four times since 1900.
There’s a reason cacti evolved in Texas as well as other arid regions of the world.
From this Warmist-site, abandoned about 10 years ago, you may wonder why they no longer show Arctic sea ice extent from about 1960 instead of 1979. But there might possibly be a reason for that.
http://nwpi.krc.karelia.ru/e/climas/Ice/Ice_no_sat/XX_Arctic.htm
A lot of interesting “old” information anyhow: http://nwpi.krc.karelia.ru/e/climas/
This is one chart that you might want to consider. It strikes at the very heart of the AGW theory. CO2 simply doesn’t absorb at the wavelength the earth emits.
http://static.cdn-seekingalpha.com/uploads/2013/8/10/7360901-13761431674136734-Robert-Wagner_origin.png
+1
I this one AM radio all the time : We went the woods the weekend and had fun climing trees. She goes onto say the trees clean the air on their leaves & trunks which takes in CO2 than gives use oxegine to beath. This what I have be leave since I was 5th grade ( Climate Change,” is a nut case for less oil for working class. BP screwed up under BHO watch! Now he and his wife use AF one and several c-17’s to carry there armed cars for any trips ! There mileage is not good ?
They at the top so they don’t count!
I was in the AF since 1965 and stayed 25 years. I fired and flew on WC-130-H model Lockeed planes chasing typhoons and some other things in Veitnam Nam 69-72. All we wanted to know was where the storm was going and who it would affect. Pressures low or high and center off eye size. We also check for any nuclear partials from the Chinaor Norh Korea!
Chemical warfar was really a big concern. These in Washington DC have supplies and under growned shelters wit tv and computers to play with. The average Ameran has nothing!
The Jews in Isael all have mashes due to Irans hot war heads!
Gerry retired disabled Vetran. Be save stoe food in cans or some type of dried food you can heat or boil!
Cheers and God Bless America.