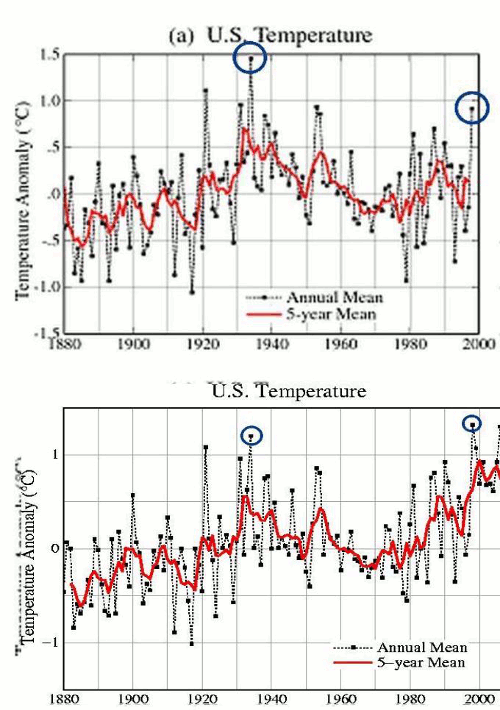
Hansen’s 1999 temperature graph is now corrupted, as seen below.
Modified on Tuesday, January 18, 2011 at 6:33:14 PM
http://www.giss.nasa.gov/research/briefs/hansen_07/fig1x.gif
http://www.giss.nasa.gov/research/briefs/hansen_07/
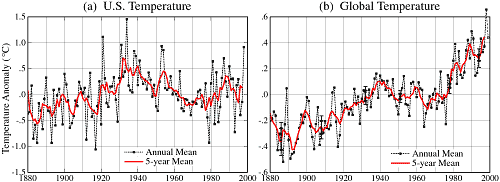
The original uncorrupted version is shown below.
This is the graph which used to show 1934 as the warmest year in the US, but was later “adjusted” to cool the past and warm the present. The blink comparator below alternates between the original (uncorrupted) graph and the later “adjusted” graph.

This graph has been changed several times – first adjustment and now corruption.


With all the evidence of corruption in high places around AGW it still, surprisingly, amazes me how this guy can hold onto his job with the sheer weight of evidence of his lies and manipulation, paid for out of the public purse. When will his bosses realise what a laughing stock he’s turning NASA into?
They used to be able to put a man on the moon and make the whole world proud.
Now they fiddle around with some weather data but can’t do it any better than blog amateurs.
How the mighty have fallen. Shame NASA, shame Hansen you crooked liar.
The way the computer model they use for surface temperature is designed the numbers are dynamic rather than static as you would find in a financial spread sheet. Each time the entire model is run the past changes. They claim it is adding additional historic data but they are not adding newly found data to 1934 so that WAG is total BS! The problem is probably more to do with the provider of the “value added” data: GHCN, NOAA! Of course the end users such as GISS, MET, CRU also add their “Quality” enhancements which do a bit more Massaging of the data and make it even more fluid.
If it was not for the “Harry Read Me” I would have believed CRU’s claim they basically just use what is provided by others. Some of the “Mail” released by various means shows they “Adjust” for best fit!
If it was “Corrupted” to start with would this be called value added corruption?
If I read your chart correctly, there has actually been some long term decline in temps since the 1930s. Why are the two charts so different? Just data manipulation?
Si
Get your electric (runs on solar) all-adaptable, super-powerful, Hansen Shredder-it dices, splices, and cuts all those inconvenient documents, studies, IRS correspondents, and more…but wait! that’s not all, you also get the best selling book, “How the New World Order will FORCE you to lose those unwanted pounds.”
The top two graphs are completely garbled when I look at them?
Don’t pay too much attention to anything NASA says about US annual temperatures in 1934, let alone global temperatures. Think about how sparse and unreliable that data must be. We have “good” data from, maybe, 100 sites world wide for 1934. You can say those sites have shown a steady rise in temperature. Global projection for the time isn’t justified.
But if the older data is suspect, how can anyone possibly say today is warmer than 80 years ago.
All you can say is that it is warmer than a few years ago, which given the warm PDO just gone is a totally meaningless statement.
To detect any trends you clearly need to go back many decades.
In any event there are many “reliable” stations from the 30’s which show no increase ( check out rural US and Australian stations for instance). The areas showing most warming seem to be where there is no reliable data even now, such as Africa.
Michael,
There were a huge number of weather stations in the US and the rest of the civilized world in 1934, totaling well into the thousands.
I’d trust temperature data from 1934 more than that from now. At least in 1934, there was no political circus surrounding global temperatures.
…and with thousands of weather stations, a few hundred bad ones are not going to affect the overall figures very much, the margin of error would be less than that we are expected to believe today.
Back in the 1930’s you had hundreds if not thousands of so called “Cooperative Observers” many of them farmers in rural areas who were given shelters, thermometers and rain guages by the Weather Bureau and asked to send in their observations on a daily basis.
I would trust their observations a lot more than those of today’s Government worker or contractor taking readings along some airport runway with a Government issued thermometer.
Put a man on the moon ?
Well the CRU emails told us – if they data does not agree with your conclusion – change the data!
I found this golden comment over at Katabasis, apparently from a US diplomatic cable which appeared on Wikileaks:
“old Soviet academic joke: the faculty party chief assembles his party cadres and, warning against various ideological threats, proclaims, “The future is certain. It’s only that damned past that keeps changing.””
I want a real investigation of the data faking. A real investigation like the cops would conduct if the dean got busted for e-mailing kiddie porn. The cops would come in and take his hard drive. They would recover all the deleted files that were not properly erased. They would find out how many megabytes the guy erased right after he knew he was busted. REALLY check for data faking. Really check for conspiracy to FAKE data.