If you doubt that parts of the planet really are warming, talk to residents of Barrow, the Alaskan town that is the most northerly settlement in the US.
In the last 34 years, the average October temperature in Barrow has risen by more than 7°C ? an increase that, on its own, makes a mockery of international efforts to prevent global temperatures from rising more than 2°C above their pre-industrial levels.
Ice loss sends Alaskan temperatures soaring by 7C | Environment | theguardian.com
Look what these Guardian scumbags did. In 1976, the PDO shift occurred, causing Alaska temperatures to rise nearly five degrees in one year. That was 38 years ago, not 34 years. There has been very little warming over the past 34 years.
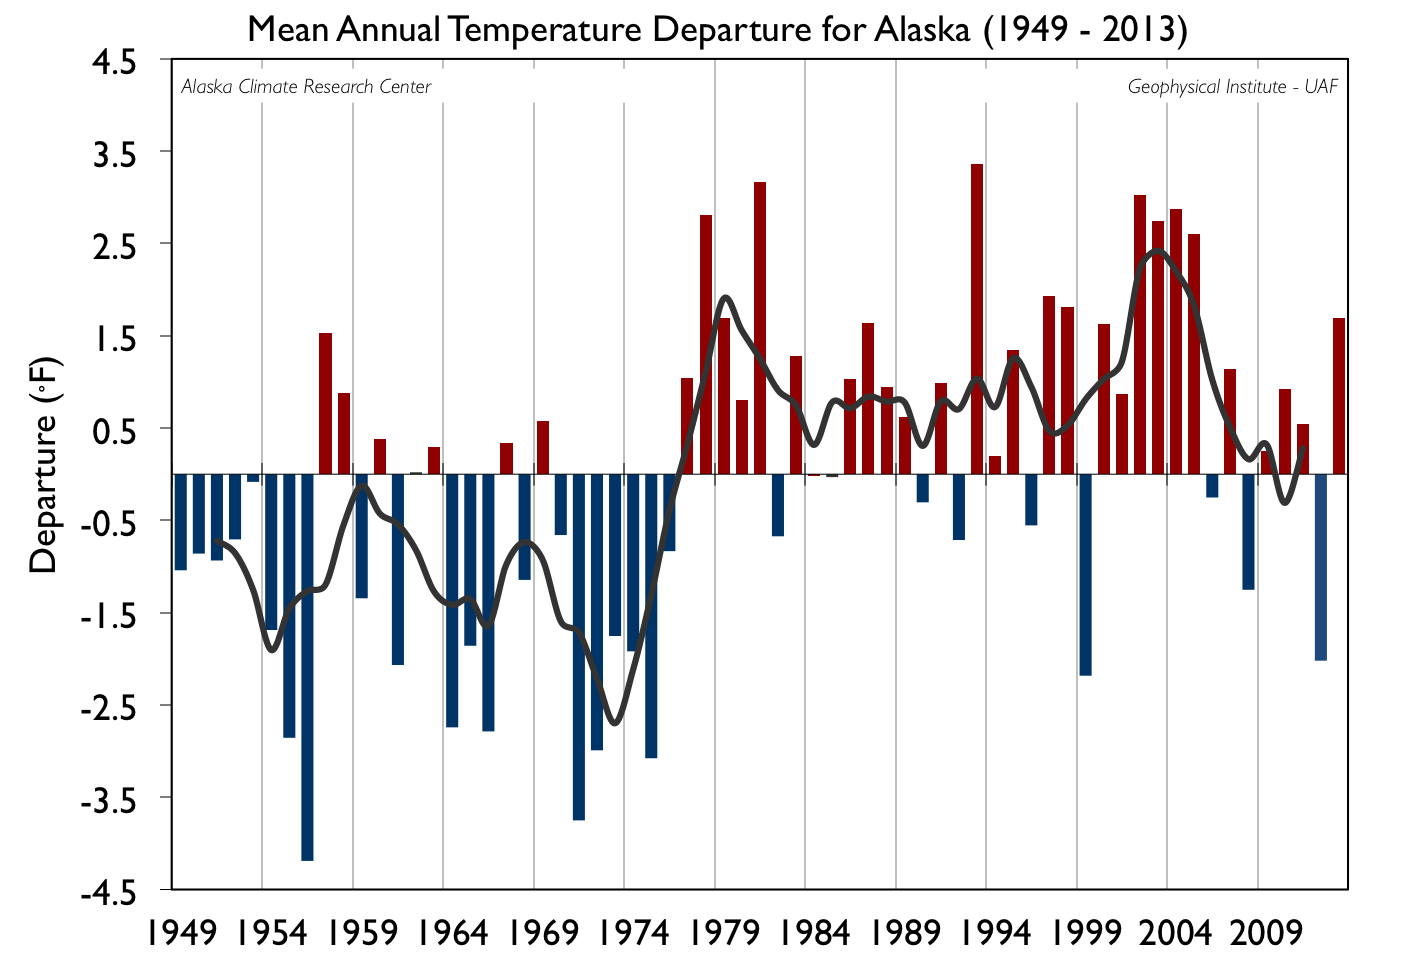
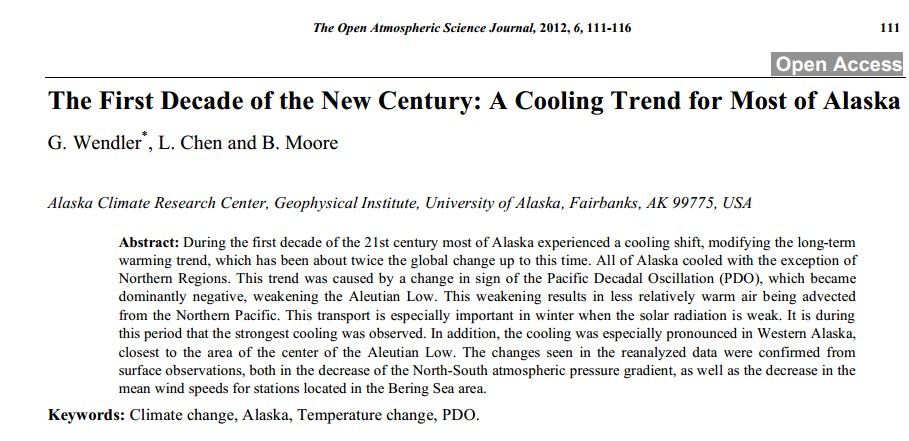
This is what the University of Alaska says.
Considering just a linear trend can mask some important variability characteristics in the time series. The figure at right shows clearly that this trend is non-linear: a linear trend might have been expected from the fairly steady observed increase of CO2 during this time period. The figure shows the temperature departure from the long-term mean (1949-2009) for all stations. It can be seen that there are large variations from year to year and the 5-year moving average demonstrates large increase in 1976. The period 1949 to 1975 was substantially colder than the period from 1977 to 2009, however since 1977 little additional warming has occurred in Alaska with the exception of Barrow and a few other locations. The stepwise shift appearing in the temperature data in 1976 corresponds to a phase shift of the Pacific Decadal Oscillation from a negative phase to a positive phase. Synoptic conditions with the positive phase tend to consist of increased southerly flow and warm air advection into Alaska during the winter, resulting in positive temperature anomalies.
Temperature Changes in Alaska | Alaska Climate Research Center
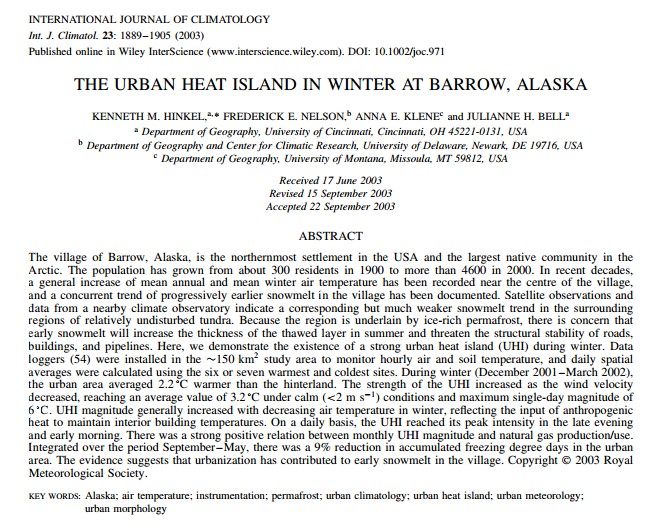
But it is worse than it seems. All of the rest of the warming at Barrow is due to UHI
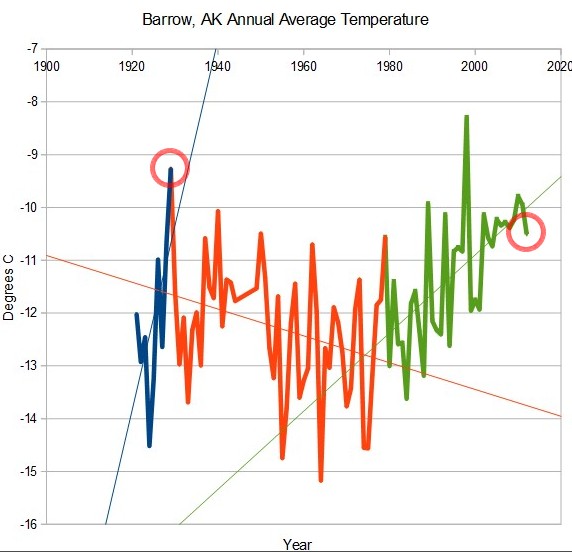
And it gets even worse. Temperatures at Barrow in 1929 were warmer than they are now, even with the recent UHI. They cherry-picked the start date because it was near a local minimum. During the 50 years prior to 1979, temperatures in Barrow fell nearly as much as they have risen since 1979. And they rose much faster prior to 1929 than they have since.
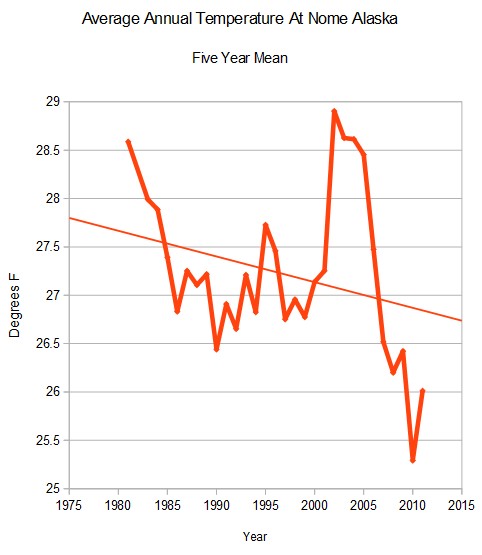
Almost every single thing the Guardian writes about climate is fraudulent. Temperatures at Nome have plummeted since 1979.
The University of Alaska says that the whole state has cooled over the past decade.
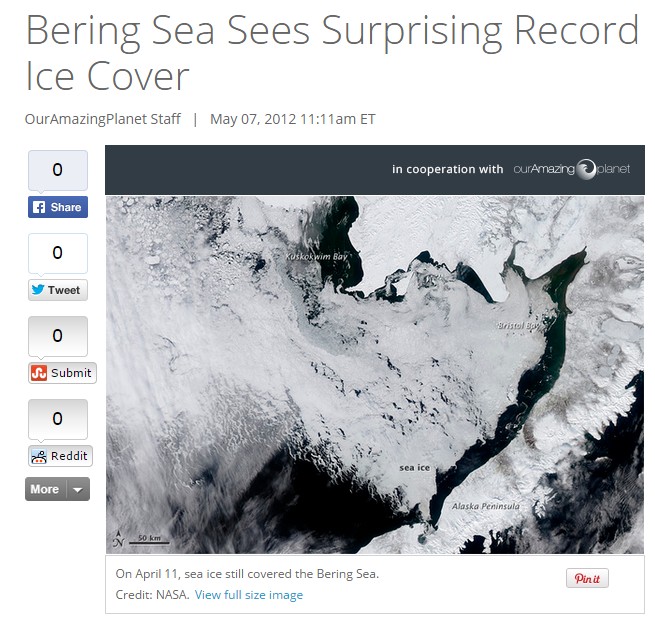
Two years ago, the Bering Sea set an all-time record for sea ice
Bering Sea Sees Record Sea Ice Cover ? Arctic Effects of Climate Change


not sure. I think the North American jet stream moves east during real ice ages and mini ice-ages. ie Alaska gets warmer during global cooling. 20,000 years ago, for example, memphis TN was covered in a glacier but Alaska was like it is now. ASFAIK
this might mean the warmists will be citing Alaska a lot in coming years, as their phony poster child
Joseph Stalin’s totalitarian control of information about nuclear energy in stars and atoms and von Weizsacker’s flawed concept of nuclear binding energy are about to collapse, freeing society to reap “powers beyond the dreams of scientific fiction” that Nobel Laureate Francis W. Aston promised in the last paragraph of his 1922 Nobel Lecture.
I even suspect that the falling price of oil reflects loss of monopolistic control of information on the nuclear process that produces all fossil fuels.
Professor Curry allowed this post on information forbidden to the public after Stalin emerged victorious from the ruins of WWII:
http://judithcurry.com/2014/10/13/my-weeks-in-review/#comment-638726
Barrow Alaska was the flagship for AGW several years ago. It was touted as an example of what global warming was doing to the climate. Citizens of Barrow noted that the snow in the city was melting earlier than usual during the spring but that the snow in the country was hanging around as usual. After awhile, alarmists quite using Barrow Alaska as their flagship event.
The same thing happened in 1998 when we experienced a super El Nino. That year became another flagship event for AGW. And then it cooled. It should have shut them up, but alarmists are a stubborn and ignorant bunch. They aren’t much into the scientific principle.
They will shut up when they are cut off.
like a cancer.
I just compared average September temperatures at Barrow measured by USCRN with the unadjusted temperatures used by GHCN-M v2/v3. I think this should quantify the UHI effect :
All Temperatures in centigrade – difference between USCRN and GHCN in brackets.
USCRN :
2003 0.1
2004 0.7
2005 0.8
2006 2.4
2007 3.1
2008 0.9
2009 1.1
2010 2.7
GHCN
2003 1.4 (+1.3)
2004 2.4 (+1.7)
2005 2.3 (+1.5)
2006 5.0 (+2.6)
2007 5.6 (+2.5)
2008 2.5 (+1.6)
2009 3.2 (+2.1)
2010 5.4 (+2.7)
Small sample size, but the results speak for themselves.
USCRN temperatures from here :
http://www.ncdc.noaa.gov/crn/report?report=newsom&network=&por_start_month=09&por_start_day=01&por_start_year=2003&por_start_hour=&por_end_month=&por_end_day=&por_end_year=&por_end_hour=&por_tref=LST&sort_by=slv&comm_only=&flags=0&elements=&element_group_id=&format=web
GHCN temperatures from here :
http://climexp.knmi.nl/data/ta70026.dat
You can’t expect the talking point distribution network to be up to date. Takes time to ship out the flyers.
Ahh, but 4 years doth a trend change.
One point, the 1921-2012 graph does show that things have warmed, from minus 11C to minus 10C.
In the Netherlands we had the same thing. Yesterday, October 18, 2014, was the warmest October 18 in De Bilt. http://www.nu.nl/binnenland/3906652/warmste-18e-oktober-ooit-gemeten.html (in Dutch language). And of course the weatherman shows on television, making a link to global warming. “Temperatures have been rising because of global warming. And that makes the chance greater for an extreme hot day like we are experiencing now”. When there was no global warming, the chance for such a hot day would be practically zero”.
People believe this kind of crap, they think the weatherman is a climate expert. But he is wrong.
If there was any global warming (which there is not for 18 years now), indeed the chance for an extreme hot day would be greater. But if there was global warming, the chance of an extreme COLD day would be practically zero. And what did we have this year: several days with extreme low temperatures. The weatherman knows that (and if he didn’t he would be a very bad weatherman), but he does not mention the cold record days we had this year. He does not mention that De Bilt has a huge UHI effect (they never mention this). He does not mention that low solar activity, such as we are having right now, causes the Jet Stream to move away from the poles and to meander. So in the Netherlands for a few days we are on the lucky side of the Jet Stream, with southerly winds blowing from the Mediterranean. And soon the Jet Stream will meander and we will have cold northerly winds, like in Russia, where there is already extensive snowfall. The weatherman knows that (and if he didn’t know he would be a bad weatherman) but he doesn’t mention that. Whenever it is hotter than usual, somewhere in this world, it is big news and it is linked to global warming. Whenever it is colder than usual, that is simply not mentioned. We, the public, don’t need to know that the earth is cooling. When there is extreme cold that they cannot hold from the public, the NH severe winters are linked to melting polar ice. That Arctic ice has recovered dramatically the last two year, that is not being told. And any explanation how melting ice in the summer can lead to extreme cold in the winter is not given. People are contantly being manipulated to believe the earth is warming, while it is really cooling.
In 1921 De Bilt registered 22.9 degrees
2.5 million people in the Netherlands who live below the poverty line will not have a problem with a warm winter.
http://www.dutchnews.nl/news/archives/2014/10/25_million_people_in_the_nethe.php
Temperatures will drop to a more seasonal 13 degrees after the weekend.
http://www.noodweercentrale.nl/de/wetter/profiwetter/stroemungsfilm/niederlande.html
Steve, you may be interested in these 2 posts over Ice Age Now, they are of Siberian Snow cover, which is way over 2013 values and does not bode well for the USA this year.
http://iceagenow.info/2014/10/siberian-snow-cover-schedule-record-pace/
http://iceagenow.info/2014/10/uh-oh-signs-unusually-cold-winter-coming/
I doubt very much if you will see anything about this in the press.
Great work.
Won’t hold my breath waiting for this rebuttal to appear on CiF, mind.
Most of what’s written above (by SG) is true However, to be fair,the Guardian article appears to recognise the more modest rates of ANNUAL temperature change demonstrated by Steve. The main point of the Guardian article,though, focuses on OCTOBER and NOVEMBER temperatures at Barrow. I’ve had a quick look and it’s possible there is an issue which can’t be explained by the PDO or UHI.
I might take a closer look later.