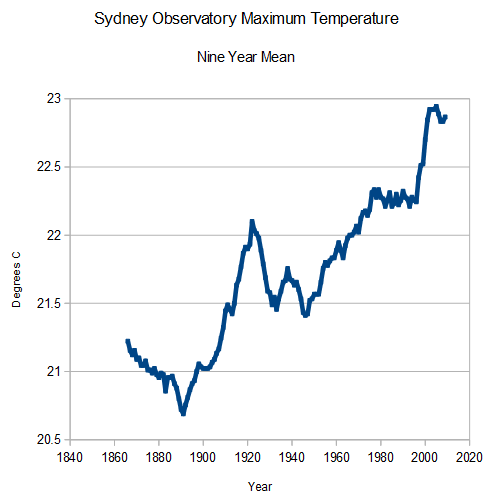
Sydney’s temperature record is just about as corrupted as it get, located adjacent to 21 lanes of asphalt and many buildings. It shows about 2C warming since the 1890s.
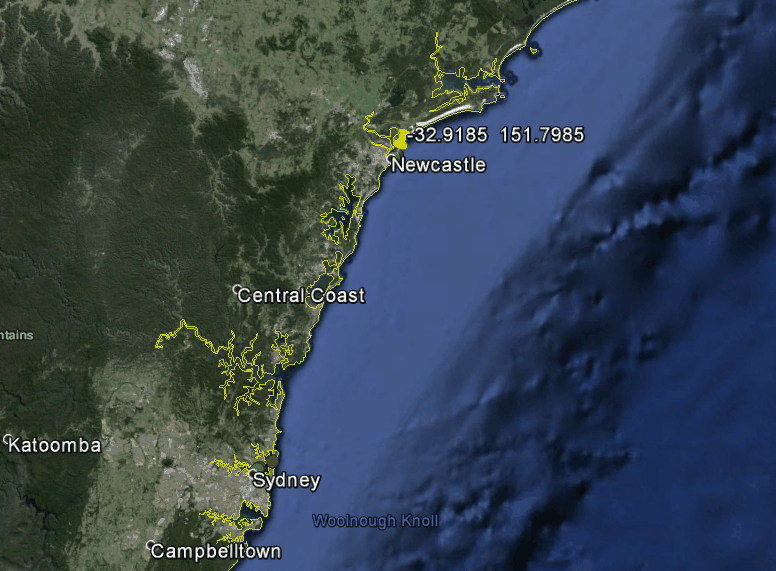
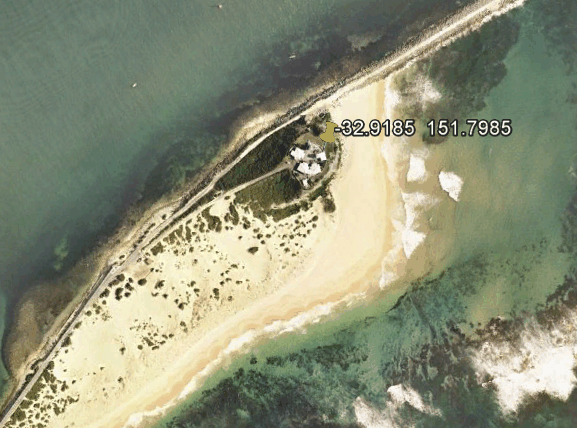
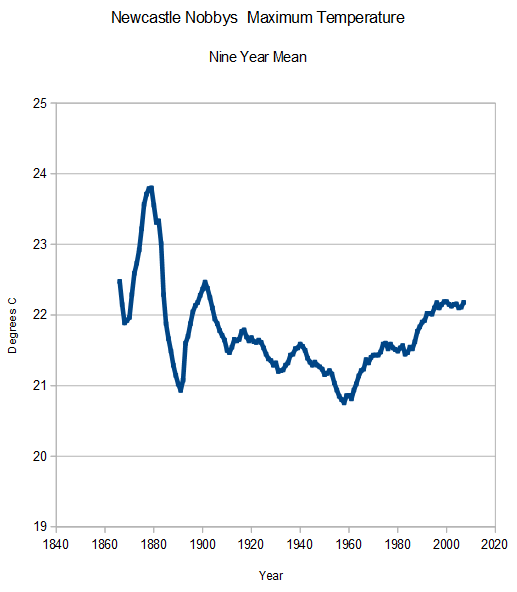
But if we move on up the coast to Newcastle Nobbys – which has one of the longest continuous temperature records in Australia , we see a completely different story. There has actually been no warming since the 1850’s at a station uncorrupted by UHI
It is quite likely that all claimed warming in New South Wales is due to UHI effects.

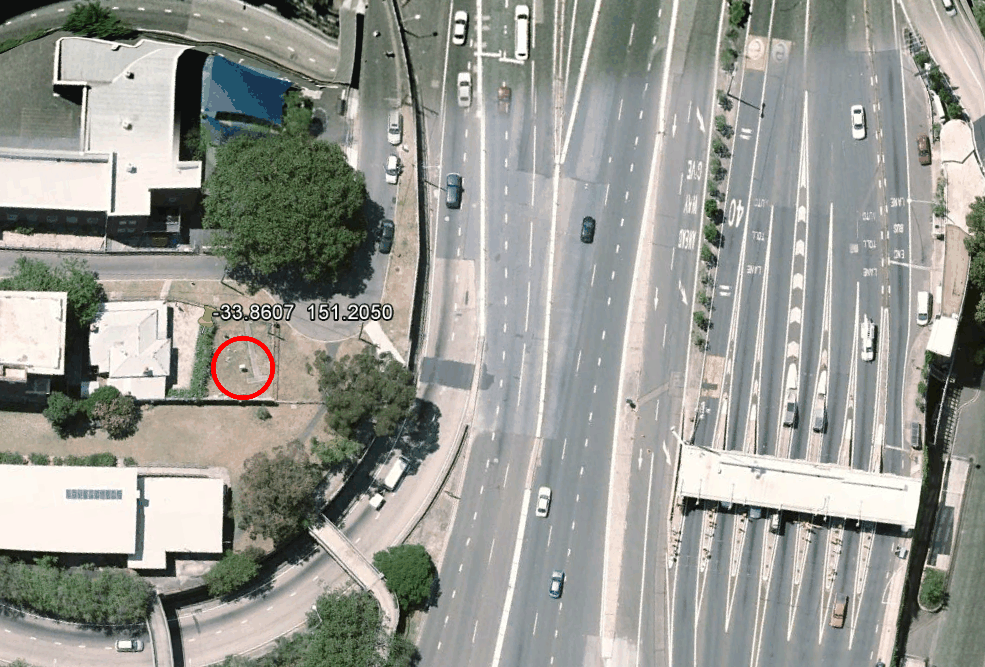

I had to look that up on Google Streetview to believe it. Sydney Observatory is about a block north of that location (still right beside the huge freeway) but there really is a Stevenson Screen at your red circle. Unbelievable.
The lat/lon coordinates in the Google Earth image are the exact coordinates listed in the GHCN metadata. That circle is the official thermometer.
And the so-called “climate scientists” will tell you that homogenization and algorithmic adjustment will dry-clean any errors spotlessly, so clean that there is no need to monitor site conditions for compliance.
It’s a good thing we have the satellites. What these city thermometers are measuring is Man-made Global Urbanization.
Pop Quiz time, boys and girls…What is the CRN rating of the two weather stations shown, and what is the correction factor that should be applied to the recorded temperatures of each? I’m sure it’s been used on all published data!
Hint: see http://www.surfacestations.org/
THEY rate it as a #1 and it should be rated as a 10. (Well below a 5)
In my part of the world, Kempsey, north of Newcastle, the hottest years and months cluster between 1910 and 1919. Needless to say, the driest year was 1902. Our hottest year, 1915, was also our second driest – so that wouldn’t have been much fun. (Probably been a bit more tar, brick and traffic around Wide Street gauge in recent decades, but not much.)
South of Sydney, Moruya Heads is an old pilot station not affected by much development, as far as I know. Nothing much going on down there with temps.
http://members.westnet.com.au/brigun/moruya_heads_temps.html
A steady dribble of sea level rise since the founding of the colony, a bit of temp fluctation, maybe some warming post 1980, a bit too dry (especially 1895-1947), a bit too wet (especially early 1950s and mid 1970s)…depending, of course, on where you are on this large continent. All up, It’s just the same old Holocene here in Eastern Oz. Drought still rules, just as in the 1790s, but we sneak in a bit of fun and greenery behind its back.
shit ,with accelerated sea level rise are you sure nobby,s is not already underwater 😉
That is also an on-ramp for the Sydney Harbour Bridge that is fairly steep.
In addition to the acres of hot and melting asphalt under the sun, there is 24-hour-a-day traffic of 200,000 vehicles coming to and from Sydney Harbour Bridge on the East, adding to the effect.
There is a move to investigate the BOM in Australia, for fraud, underway now thanks to JoNova and others.
But despite the obvious UHI effect at many stations, they still warm the present and cool the past. Isn’t that an obvious smoking gun with respect to fraud?
YES!
There can be no doubt in anyone’s mind after following the propaganda for years that this is flat out fraud on a grand scale. Fraud to rival Fractional Reserve Banking in its wholesale theft of wealth from the poor and middle class.
They’ve just moved the weather station from Nobbys to the local Airport.
That is not a joke.