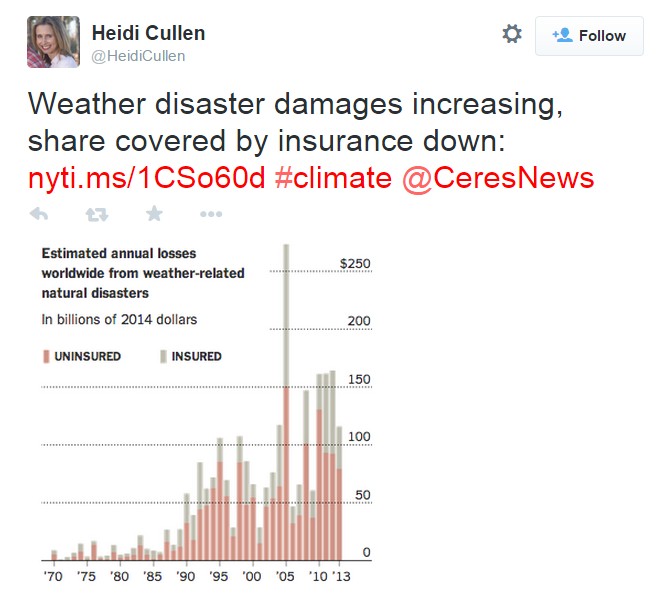
Look at 1974 in Heidi’s graph. That was the year of the worst tornado outbreak in US history, and the year Darwin was wiped off the map by Cyclone Tracy. Then there was the Bhola Cyclone in 1970 which killed half a million people. Heidi thinks there wasn’t much damage.
You just can’t make up stupid like this.
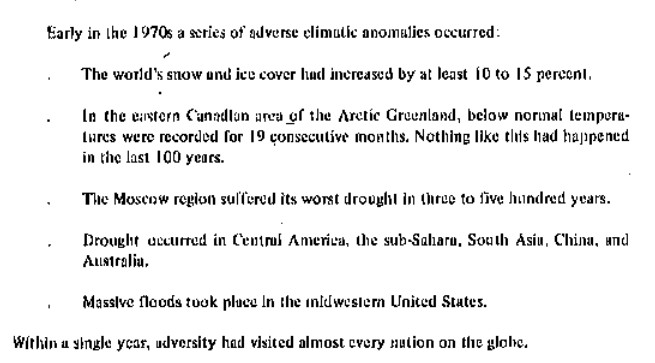
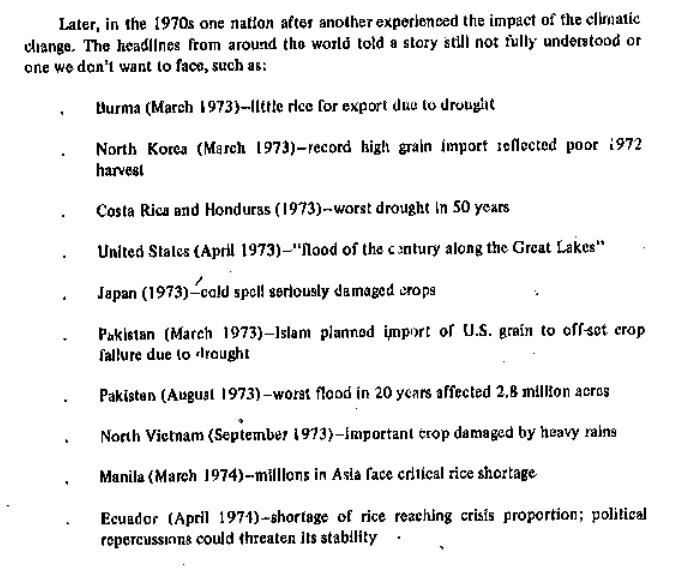
Here is what the CIA said at the time :


In 1970 was there $1B in wealth concentrated inside the radius of a hurricane outside the U.S.?
Not sure – but I believe the 1970 Bhola cyclone did $1B worth of improvements.
In 1975, Australia’s GDP was $15 Billion. In 2014 its over $1500 Billion (i.e 100 times)
The chart is flawed and meaningless and Heidi demonstrates economic imbecility.
Just another example of – Squirrels!!
Hard to know what it proves – if anything – other than that people increasingly choose to deliberately build in harm’s way. Not sure that the 2004 tsunami can be attributed to “weather.”
A molten iron cyclone under the mantle caused shifts in lithic pressures which moved the tectonic plates creating a sea floor temblor causing the tsunami… see “weather.”
(Grant money please, a mix of small and large bills will be acceptable. Make it worth my while and I’ll prove it was CO2 what done it.)
Yeah, once you adjust for inflation (a billion dollars doesn’t buy what it used to) and population (a lot bigger cities now) you get some view of the reality.
Mind you, adjusting for inflation is kind of difficult, and people tend to have higher value items now (in 1970 the flood would not have damaged your expensive laptop).
Just How Stupid Is Heidi Cullen
On a par with Katharine Heywhore
They’re both an embarrassment to crackpots everywhere.
That is sure some fickle climate change. In only 5 months between March and August of 1973 Pakistan’s climate ‘CHANGED’ from a climate of permanent drought, to a climate of the worst floods in 20 years, and in a mere 31 more days IT morphed into a climate of permanent flood.
Now I know that Gaia is female because her ‘CLIMATE’ changes as often as the weatherman’s WEATHER.
Just How Stupid Is Heidi Cullen
In she is just one of many that pulls the statistics of ‘climate scientist’ stupidity away from a normal Gaussian distribution and quantifiably shifts it to the total inanity of a sanatorium.
I guess we know what plan B was for GISS, in case the satellite data kept “diverging” from their own dataset.
http://www.washingtonpost.com/blogs/capital-weather-gang/wp/2014/10/22/weather-service-stops-receiving-satellite-data-issues-warning-about-forecast-reliability/?hpid=z5
They must have installed an off-switch, just in case.
There is no “off” switch. The satellites have an AI module. They compare their measurements to a climate model output and if the numbers are not close, they feel ashamed and stop sending data.
Is Heidi aware that the population of the world increases? I see she actually adjusts for inflation, which is unusual, but not adjusting for population is also bogus. How much damage due to weather was there before humans existed? None? What an idiot.
Pal-Review: “No evidence AGW has increased normalized loss from natural disasters.” http://t.co/LGAYaDyaYo
Cullen is not stupid. She’s a liar.
Nailed it!
+10
Can’t she be stupid and a liar?
You’re all missing the nugget of gold in the article! In the 1970’s the world’s snow and ice cover increased by at least 10-15%. To me that would mean that the 1970’s were the period of extreme weather and that we are now in a period of moderation returning to the mean.
What is the source of that graph?? So in **today’s** dollars, 1974 (which had the super outbreak of tornadoes in the US) is an order of magnitude behind last year, when we had hardly anything? No real hurricanes either? Something is very fishy about that…
Her graph is way off. The real situation is much worse than she thinks. If she did her graph correctly, showing the figures in Zimbabwe dollars, she would realize just how much worse it is.
What is Heidi’s chart supposed to demonstrate, population growth, the increase in worldwide wealth, the increasing amount of developed property and infrastructure, or the inflation in damage claims per event?
There are four types of inflation that need to be considered: 1) general price inflation (affects rebuild/repair costs), 2) quantity inflation (more people, more structures to damage), 3) quality inflation (larger more complex structures), and 4) high-risk location inflation (more structures along seashores, etc.).
From Roger Pielke, Jr.’s testimony to Congress:
“What the data says:
1. Globally, weather-related losses have not increased since 1990 as a proportion of GDP (they have actually decreased by about 25%).”
http://docs.house.gov/meetings/SY/SY18/20131211/101589/HHRG-113-SY18-Wstate-PielkeR-20131211.pdf
Is there any correlation between the number of trolls visiting these comment sections and the nose dive of the CAGW meme? It seems like before some warmist troll would have taken a shot at defending Heidi’s agit prop.
I think such correlation does exist but it could be coincidental. Most warmists are of the Left and as such they are currently spread thin fighting at so many fronts at once.
I think the real question is the nature of the stupidity we’re seeing.
It’s worth quoting Jean Cocteau in this connection: “One of the problems of our time is that stupidity has begun to think.”
And of course, stupidity has so many more venues nowadays for self-expression …
Of course weather disaster damages could be increasing-there’s more people in the way and things cost more. But that’s nothing to do with the severity or frequency of storms.
Heidi isn’t stupid she is greedy.
I’d say this stupid, i.e. not stupid at all, because they all know how to ram complete bullshit through the media: