
The US Drought Monitor (generated in Washington DC) shows areas which are wetter than normal as being in extreme drought. Look at Tucson, Az, and compare with the PMDI map at bottom.
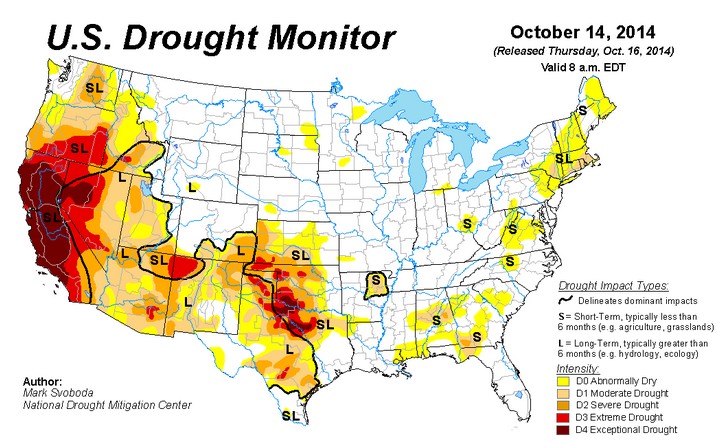
The US Drought Monitor (generated in Washington DC) shows areas which are wetter than normal as being in extreme drought. Look at Tucson, Az, and compare with the PMDI map at bottom.

Incompetence, corruption, or both. Probably both.
i live and work in the area of SC shown in yellow on the US Drought Monitor. We are well above average rainfall for the year, with this being one of the wettest summers in memory. A front came through the southeast less than 48 hours ago giving us an additional ~1/2″ of rain.
My part of VA is abnormally dry. I guess the four inches of rain this WEEK doesn’t count.
Same in CT; we got 4 inches over the past week or so too.
Yes, but it is a dry, droughty, thin first year wet that doesn’t stand up to adjustments by the worlds top alarmists 😉
Alarmists never were the type to let facts get in their way….
Do they have the same criteria and data? Just like anything governmental, it’s worse than we thought.
And now a word from our sponsors
Small print –
Remember global temperatures, and grants, may go up as well as down; climate viewed in the mirror may be inverted
Down on the Mexican border SW of Tucson, we had a great summer rainy season: 20 plus inches. To be fair, however, this followed a less wet summer last year and a very dry winter.
Love the rain!
My area of VA is labeled as abnormally dry also. I wish that whoever made that map had to get my motorcycle up my soggy and muddy back yard this morning to go to work! trees are falling on our property because to the soaked ground. I don’t think I have seen it any wetter this past week and I have lived here 19 years.
I don’t thin I have seen it any wetter THAN this past week…
I drove across I-8 to Phoenix yesterday. It was startling to note how green the desert is. In the 90’s it was extremely dry and a bunch of people looking to get rich on jojoba oil planted rows of bushes south of the Interstate. It was so dry they couldn’t get enough oil to compete with other markets. Many plants died. Yesterday I noted those plants were as green as the green on the Palmer Index chart. Large areas south of Phoenix had grass growing in flat areas along with the desert scrub brush. Small yellow flowers are beginning to carpet some areas. I’m sorry I didn’t take time to get photos of the large yellow patches. This has been going on for a decade.
In Yuma and along the Colorado River we are not getting as much water as the desert 50 miles east of us. Yet we are correctly shown as having above average rainfall. In California the rain keeps east of El Centro. The rest of Southern California really is being ignored by the Pacific hurricanes and storms. Also, we are now having mostly dry days in the low nineties dropping into the low sixties at night. Very refreshing. We can now have breakfast on the veranda.
There’s actually a dry ghost hovering over Arkansas, just north of Louisiana on that first map, but don’t worry, its labeled “S” so its a short-term specter!
I would think that the percentage of the US in significant drought must be near record lows.
According to the legends on the two graphs, it is a moderately moist drought.
That explains it.
Moderately moist drought.