2014 melt season in review | Arctic Sea Ice News and Analysis
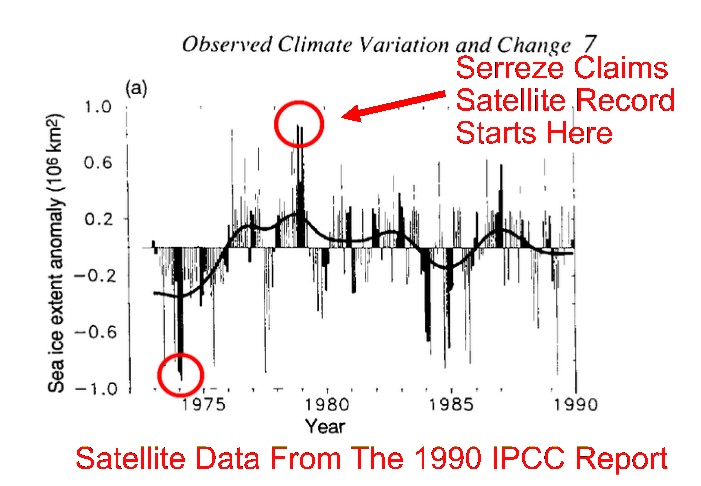
Mark Serreze continues to claim that the satellite record began in 1979, which he knows isn’t true. NSIDC has satellite data for Arctic ice going back to the 1960’s.
The 1990 IPCC report had satellite data going back to the early 1970’s, which shows that 1979 was right at the peak, and two million km² higher than 1974- meaning that current ice extent is about the same as 1974
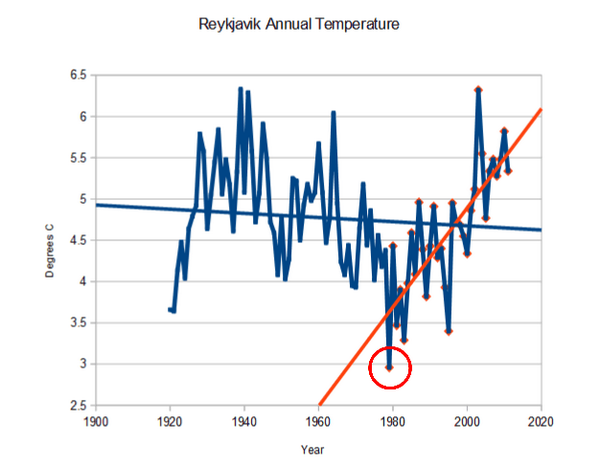
1979 was the coldest year on record in the eastern Arctic. Starting graphs in 1979 without prominent disclaimers that it is a cherry-picked, misleading year – is blatant malpractice.
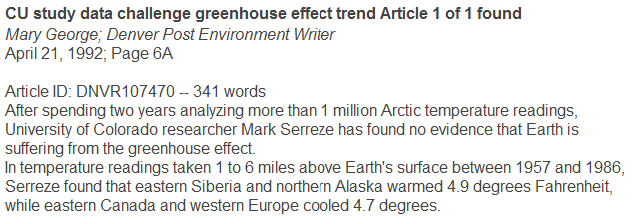
Mark Serreze used to be a skeptic, before he went over to the dark side


Re blatant malpractice …. the swine knows exactly what he is doing!
Tony FYI … look at the snow coverage in Canada! It was on the news last night and was extensive and high for this time of year, especially the lobe covering most of Manitoba and into western Ontario.
Excellent observation. Serreze and other climate scientists have shown again and again that they will resort to any subterfuge to keep the global warming scare alive and the funding pipeline filled. They know how to create a story that will garner research contracts and media attention. Fleecing taxpayers is their specialty.
If you’re a scientist in the academia and dare to question the AGW talking points, you’ll soon find yourself on the outside looking in — the target of vicious personal attacks and peer ostracism. And forget tenure. You’ll be lucky to hold onto your job. Such is the state of “climate science” in the halls of academia.
+1
Only those who are retired or close to retirement can speak out.
” Mark Serreze continues to claim that the satellite record began in 1979, which he knows isn’t true. NSIDC has satellite data for Arctic ice going back to the 1960’s”
Ok – but does that actually invalidate his claim that “The ten lowest September ice extents over the satellite record have all occurred in the last ten years”. By all means, bring these people to account when there is genuine cause but there is nothing in the NSIDC link which can be considered misleading.
Extending the 1979-2014 graph back to include the earlier 1970s is going to change the overall picture very much.
Sorry “is going to change the overall picture very much” should say “is NOT going to change the overall picture very much”.
Twilight Zone music ….
Serreze conveniently fails to mention that arctic sea ice extent has been growing since its low in 2012, which itself was apparently caused by a massive arctic storm that broke up the ice and accelerated the summer melt.
Is his son named Luke? 😉
And, why does Serreze ignore this: “Antarctic sea ice hits record levels as it reaches 20 MILLION square kilometers for time time since records began in 1979
Serreze also knows he has been taking advantage of a positive PDO in making his ice predictions. Poor bastard must be crapping his pants now that it has gone negative and the extent is going to continue to increase as Dr. Gray predicted sooo looonnng ago.
But, naw, Serreze won’t be bothered. He’ll just jump on the “we’re going into another Ice Age meme” and continue to drain the scientific grant coffers.
How soon we forget.
Other way round, I think. PDO has been negative throughout much of the warming:
http://www1.ncdc.noaa.gov/pub/data/cmb/teleconnections/pdo-f-pg.gif
I should clarify: I meant throughout much of the Arctic warming.
The Pacific is a huge mass. It has a latency during the transitions of about a decade. The previous cycle (1945-1975) ended in 1975 but the warming of the atmosphere didn’t start in earnest until 1985. I was expecting to see the cooling start around 2011 since Dr Easterbrook called the switch to the negative phase in 2001.
The Arctic ice extent is now close to one standard deviation from the average and that average was mostly taken over the positive phase of the PDO.
It will be very interesting to see what the Arctic/Antarctic ice average looks like after an entire 55-60 year PDO cycle.
Just my SWAG but could that be why the Antarctic is growing so much quicker? It is more exposed to the Pacific and its temperature swings than the Arctic.
Thanks for the clarification
Here’s some historical context I came across, thanks to the Norwegians. It’s not the whole Arctic. but is a significant port of it.
“The extent of ice in the Nordic Seas measured in April has been subject to a reduction of ~33% over the past 135 yr. Nearly half of this reduction is observed over the period ~1860–1900, prior to the warming of the Arctic. Decadal variations with an average period of 12–14 yr are observed for the whole period. The observation series indicates that less than 3% of the variance with respect to time can be explained for a series shorter than 30 yr, less than 18% for a series shorter than 90 yr, and less than 42% for the whole 135-yr long series. While the mean annual reduction of the April ice extent is decelerating by a factor of 3 between 1880 and 1980, the mean annual reduction of the August ice extent is proceeding linearly.
The August ice extent in the Eastern area has been more than halved over the past 80 yr. A similar meltback has not been observed since the temperature optimum during the eighteenth century. This retrospective comparison indicates accordingly that the recent reduction of the ice extent in the Eastern area is still within the variation range observed over the past 300 yr.”
Anomalies and Trends of Sea-Ice Extent and Atmospheric Circulation in the Nordic Seas during the Period 1864–1998 by TORGNY VINJE, Norwegian Polar Institute, Oslo, Norway
http://journals.ametsoc.org/doi/pdf/10.1175/1520-0442(2001)014%3C0255%3AAATOSI%3E2.0.CO%3B2
Interesting paper – Thanks for posting it.
“The effect of wind patterns on the ice extent, east and west of a trough or a ridge over Greenland is illustrated by the negative correlation between the ice extent variations in the eastern area and the Newfoundland–Labrador Sea (Figs. 5a,c). The above evaluation indicates that significant reductions/increases in the Nordic Seas ice extent correspond with significant increases/reductions in temperature only when southerly/northerly winds occur during some winters in sequence (Fig. 6). This indicates that changes in ice extent and temperature in the Nordic Seas are highly dependent upon a year-to-year repetition of troughs/ridges over Greenland, a feature that in turn is connected with the positional stability of troughs/ridges in the circumpolar Rossby wave
pattern.”
Paper was published in 2001. Know of any updates?
The Arctic has been declining 0.07 degrees per decade from a high in 1935 until 2001. I would imagine that the last 13 years , with the Hiatus in warming, do not match 1935. What is extraordinary is the speed of warming from 1900- 1938, far faster and extreme than the last 30 years.
http://earthobservatory.nasa.gov/Features/ArcticIce/arctic_ice3.php
A possible explanation:
Has he made any comments in reference to the IPCC satellites? My guess would be no.
His organization, NSIDC has the pre-1979 satellite images on their web site. He knows about them.
Vinje’s work was cited by IPCC, TAR
Figure 16-3: Time series of April sea-ice extent in Nordic Sea (1864-1998) given by 2-year running mean and second-order polynomial curves. Top: Nordic Sea; middle: eastern area; bottom: western area (after Vinje, 2000).
http://www.ipcc.ch/ipccreports/tar/wg2/images/fig16-3s.gif
The link is to an interesting chart.
Interesting, indeed. We’re seeing sea ice melt during years when human-induced CO2 emissions could not possibly have been the culprit. In fact, the graph probably reflects the great warm-up that followed the planet’s emergence from the Little Ice Age.
In the meantime, the northern Canadians are not quite ready for winter:
http://northwestpassage2014.blogspot.com/2014/10/western-nunavut-businesses-stuck.html
This post is great. The two arctic sea ice graphs are great.
However, I wanted to look up the 1990 IPCC graph myself, and quickly ran into a stumbling block: the report is in three pieces, and has some summary overview. When people post genuine reference stuff like this, can a quick note be included noting where exactly it came from, such as “(Working Group I report, chapter [x]).”