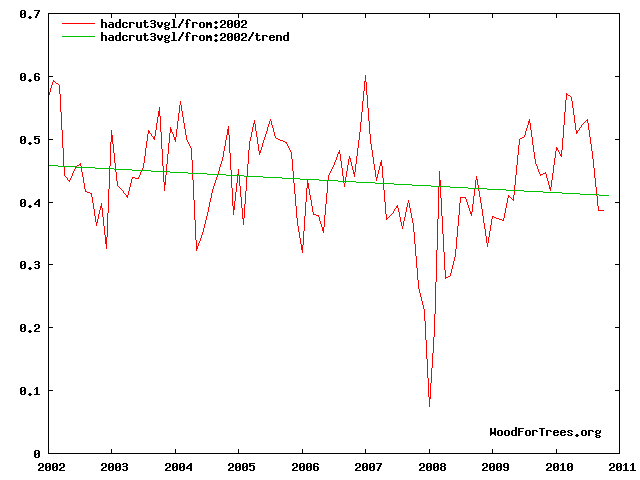
The average temperature of the Earth is rising at a rate that far exceeds that which would be expected based on natural causes alone. This is known and accepted by the vast majority of climate scientists and most of the thoughtful leadership in this country and around the world.
The key phrase here is “average temperature.” Looking out your window and seeing snow does not mean that global warming does not exist. It simply means that it is winter. What matters is that annual average temperatures are showing an alarming upward trend.
There are uncertainties about how much warming is related to human activity, but logical cause and effect relationships tell us that some percentage of it probably is. Could it be 100 percent? With so much at stake, do we want to quibble over that answer for very long?
We who viewed the “Church of Global Warming” cartoon that recently ran in this paper (Dec. 28) must remember that opinion is not the same as science. The science, though inconvenient, is pretty clear in this area.
Dr. Reid Pettit, Pontiac


This guy must be living on another planet. Either that or he is a puppet from the CLB!
Awww that graph is cherry picking and you know it Steve. If you had o’ started in 1998….oh hang on, sorry.
That graph is cherry picking and you know it Steve. If you had o’ started in 1934….oh hang on, sorry.
That graph is cherry picking and you know it Steve. If you had o’ started at the end of the little ice age, you’d see a clear warming.
“Awww that graph is cherry picking and you know it Steve. If you had o’ started in 1998….oh hang on, sorry.”
Seem to me that would be a bad cherry to pick afaik ? – or am I wrong ?
http://www.woodfortrees.org/plot/hadcrut3vgl/from:1998/plot/hadcrut3vgl/from:1998/trend
It depends on your method of adjustment and smoothing!
Maybe a meaningful reference point would be 5,000 BCE! That would display global climate changes!
Errr, the dreaded 0.04 degree raise after 13 years, why that’s 0.32 degrees/century. I think we can all live with that.
Thanks Mike! – I really dont much about it, would you mind give me an example with the 1998 plot if anyway possible with the dataset and woodfortrees tools?
Hi Erik
was my sarcasm too subtle?
Erik:
I regard the Woodfortrees site as just being a way to regurgitate garbage data. Global temperature is a fantasy as there is no global temperature but an imagined number that is supposed to represent global temperature.
With garbage / corrupted data as the starting point for any results the results will only be garbage.
You are talking about a set of numbers that are not even statistically significant and so far within the errors that any claim is just promoting an agenda.
There is NO “Fairly” “Reliable” sea surface temperature before the satellites were launched and the oceans account for over 70% of the surface area. Surface temperature measurements are taken at locations that account for less than 1% of the surface of the land and with an average of 2C error in those measurements the best that can be said for any sort term claims is we do not know.
If people continue to Cherry Pick garbage data to prove “Warming” then Cherry Picking is acceptable to disprove it or at least draw attention to the ignorance of the claims.
Shorter than a few thousand years is weather when referring to more than regional conditions and even regional conditions need a couple of hundred years or more.
Hi Baa Humbug
No, I’m just a bit slow, will look at it again The Day After Tomorrow 🙂
Mike Davis:
I agree, I don’t trust anything but Roy Spencer certified satellite data and it never was about CAGW anyway, so I’m fine with cherry picking the alarmists own garbage data for rebut
“average temperature.”
What a strawman…..
“natural causes” is the point
Do these people actually belive the crap coming out of their mouths?
Steve’s being generous, he could have used the whole decade……
http://www.woodfortrees.org/plot/hadcrut3vgl/from:2001/plot/hadcrut3vgl/from:2001/trend
Please note that it is without the searing Greenland has given the world in the last two months.
Average temperature. The high temperatures are not getting hotter. The low temperatures just aren’t as cool as they used to be. Urban Heat Island effect (UHI) caused by all the brick, concrete and asphalt man has put everywhere. CO2 has nothing to do with it.
Totalitarian governments will often invent an imaginary crisis in order to justify a power grab.
I guess I should start putting the Dr. in front of my name so I will sound important when pontificating on subjects I know nothing about.
Anyone can, and it seems a lot of the religious AGW faithful do.
Michigan trend 1985-2009 was -.01F degrees per decade.
Global trend? look here: http://www.woodfortrees.org/plot/hadcrut3vgl/from:1981/to:1990/plot/hadcrut3vgl/from:1981/to:1990/trend/plot/hadcrut3vgl/from:1991/to:2000/plot/hadcrut3vgl/from:1991/to:2000/trend/plot/hadcrut3vgl/from:2001/to:2010/plot/hadcrut3vgl/from:2001/to:2010/trend
The idea of global averages is useless information that tells us nothing about impacts at a local or regional level. What would the good doctor ascertain from the graph above and how would he show any correlation to CO2? Besides SST and LST are superficial as they ignore the Earth’s heat sink which has not shown any warming based on ARGO measurement. That is why GISS won’t incorporate accurate OHC into its measurement. The scam requires that Hansen do all he can to make warming look as threatning as possible in order to provide the growing fear needed to get Dr. Pettit’s panties to migrate ever deeper into his crack.