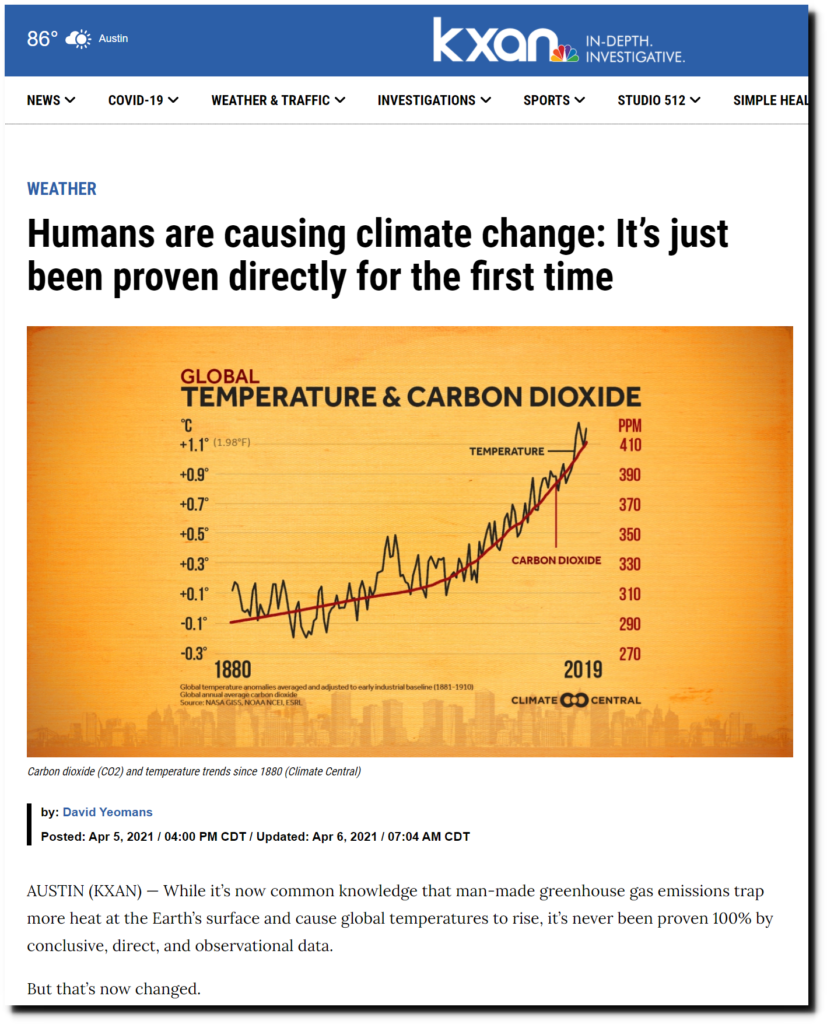
The breathless headlines have arrived : “Humans are causing climate change: It’s just been proven directly for the first time”
Humans are causing climate change: It’s just been proven directly for the first time | KXAN Austin
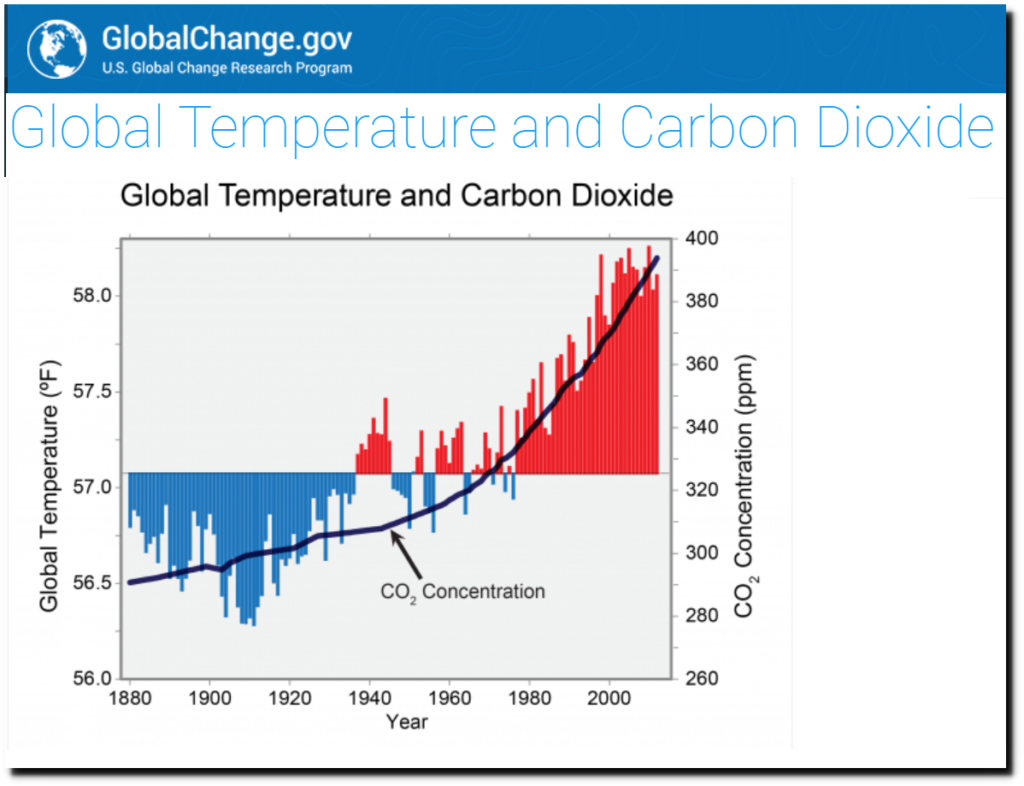
All they actually did was replot the same graph which the US Government has had out there for several years.
Global Temperature and Carbon Dioxide | GlobalChange.gov
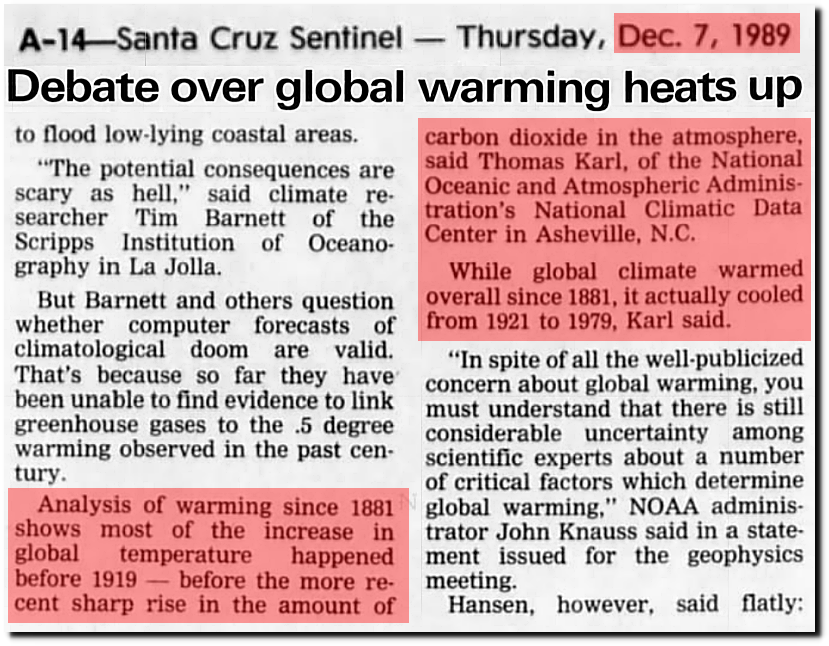
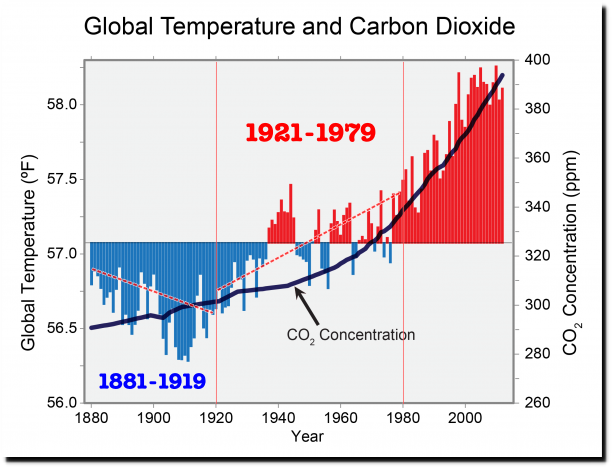
This graph directly contradicts what Tom Karl, longtime head of NOAA’s National Climatic Data Center said in 1989. He retired in 2017 just as President Trump took office.
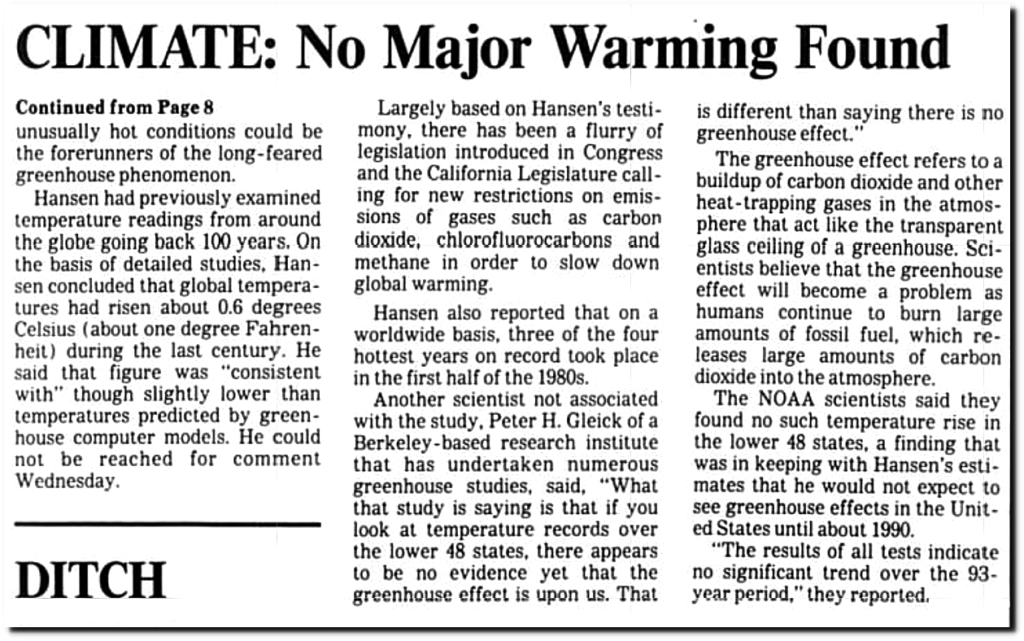
“Analysis of warming since 1881 shows most of the increase in global temperature happened before 1919 — before the more re-cent sharp rise in the amount of carbon dioxide in the atmosphere, said Thomas Karl, of the National Oceanic and Atmospheric Administration’s National Climatic Data Center in Asheville, N.C. While global climate warmed overall since 1881, it actually cooled from 1921 to 1979, Karl said”
07 Dec 1989, Page 14 – Santa Cruz Sentinel at Newspapers.com
The warming from 1881-1919 has turned into cooling, and the cooling from 1921-1979 has turned into warming. When academics and government employees are willing to tamper with data – they can “prove” anything.
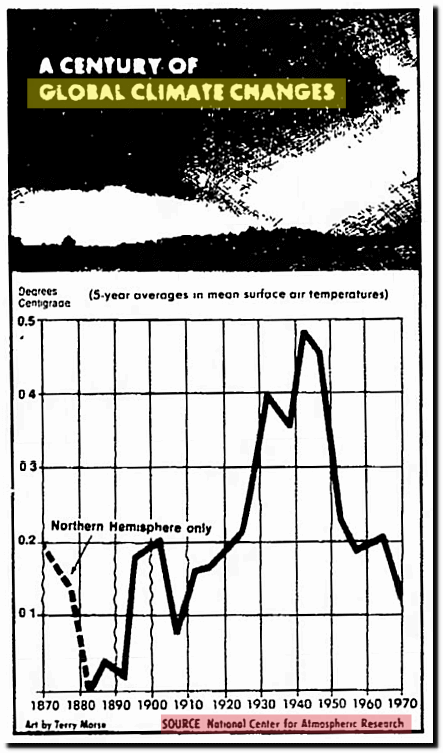
Global temperature his has been rewritten by government scientists over the past 30 years In 1974, the National Center For Atmospheric Research showed no net warming from 1870 to 1970.
14 Jul 1974, Page 1 – Lincoln Evening Journal at Newspapers.com
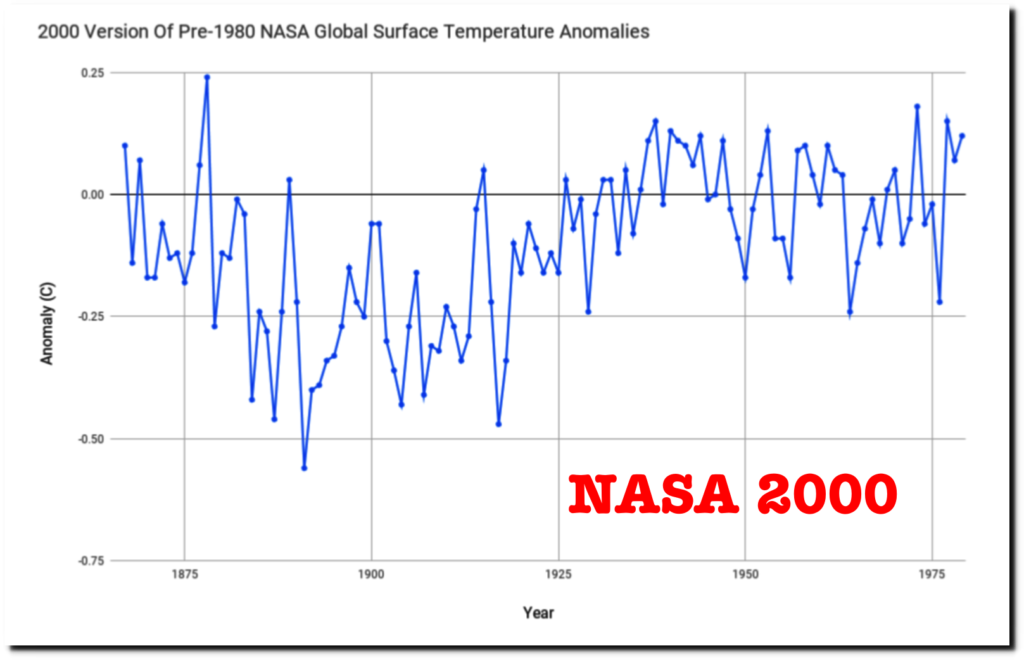
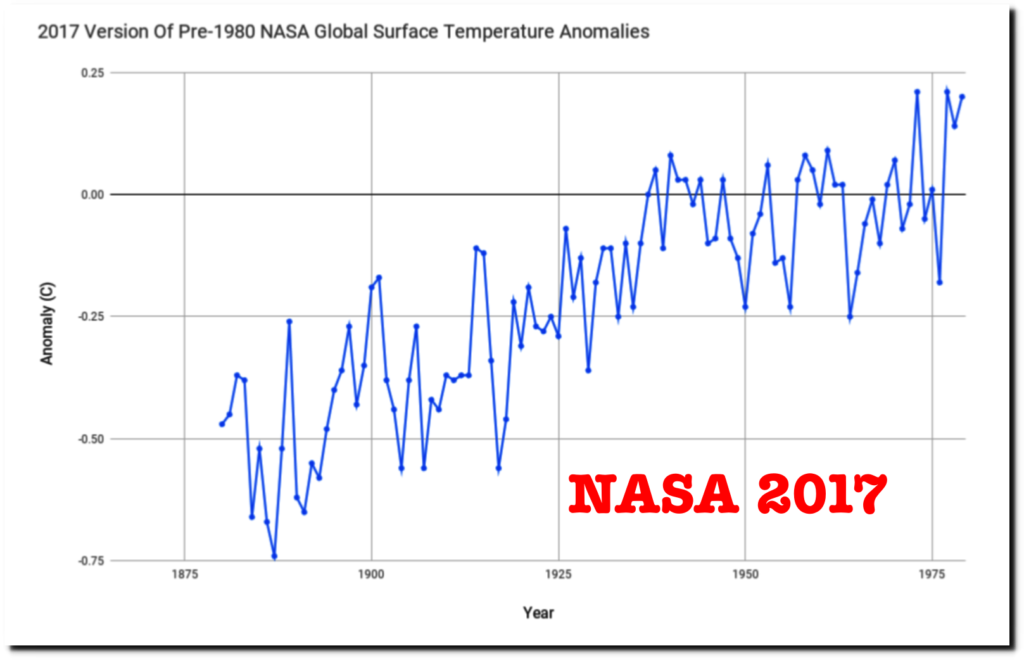
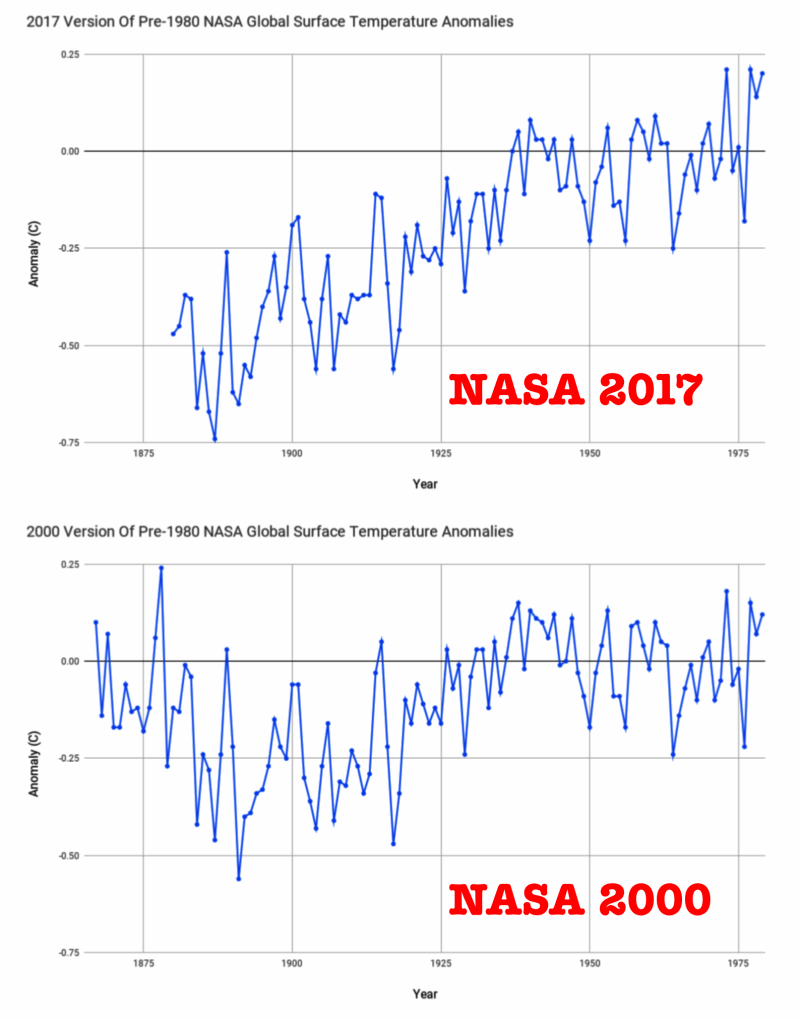
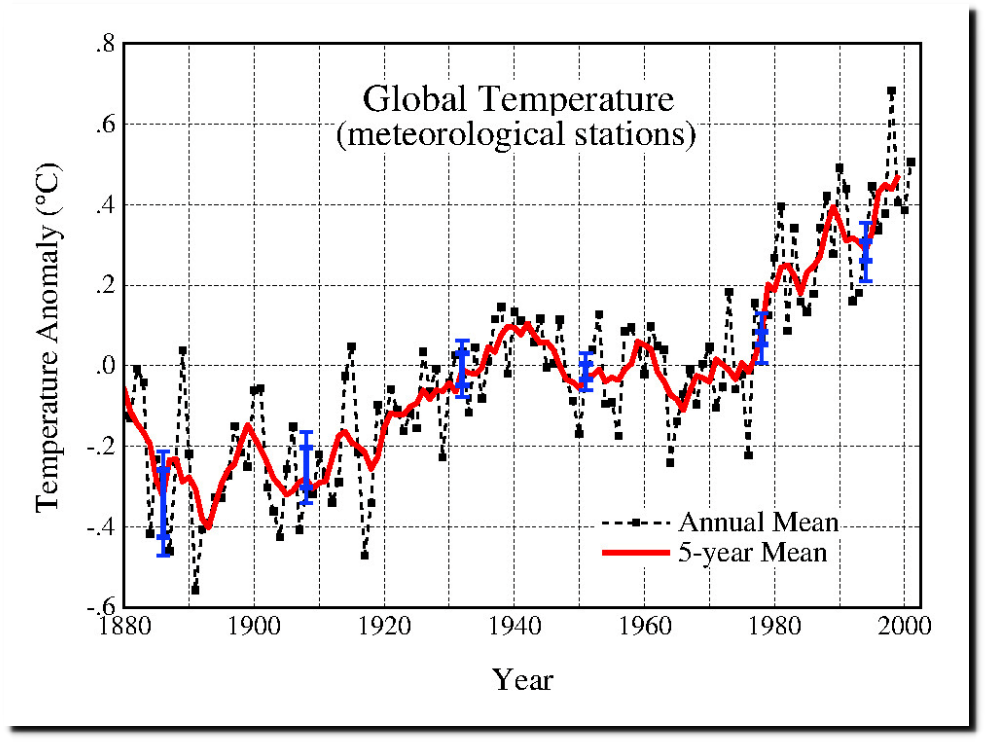
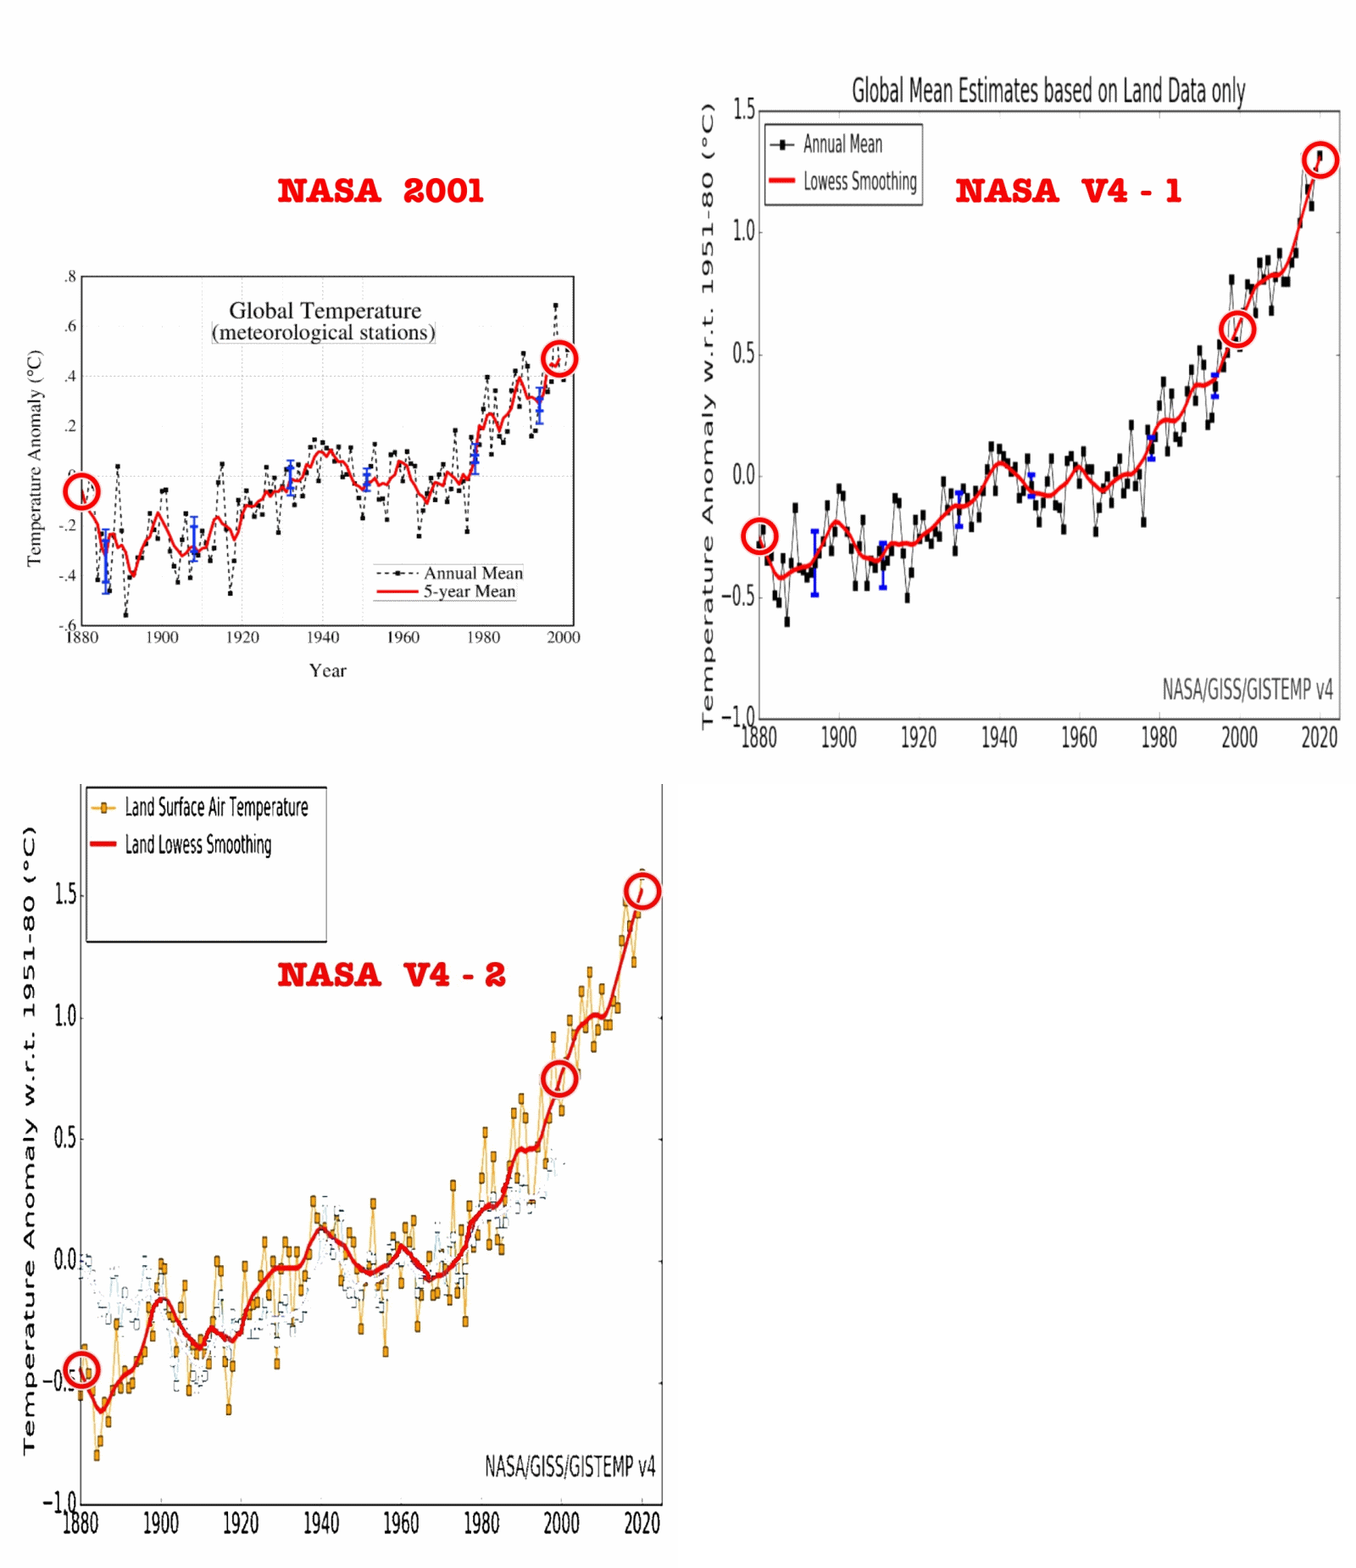
As of the year 2000, NASA showed no net warming from 1866 to 1979, with 1878 being the warmest year of that period.
But they now hide data before 1880, and show about 0.7C warming prior to 1980
https://data.giss.nasa.gov/gistemp/history/output/met_used.zip
This animation shows how they have altered the data
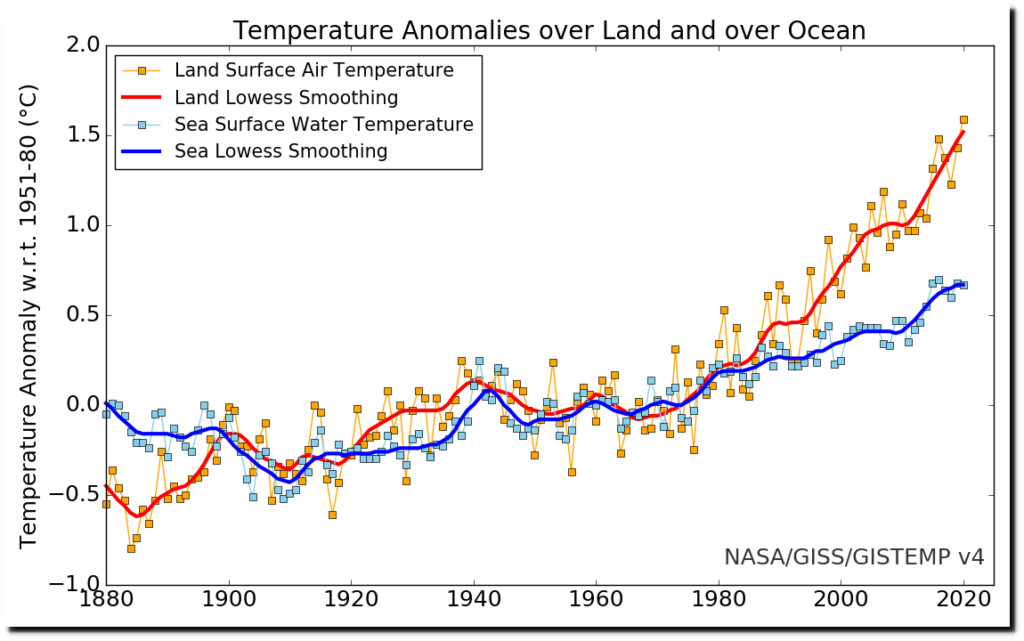
NASA GISS v4 shows more than 2C warming over land since 1880.
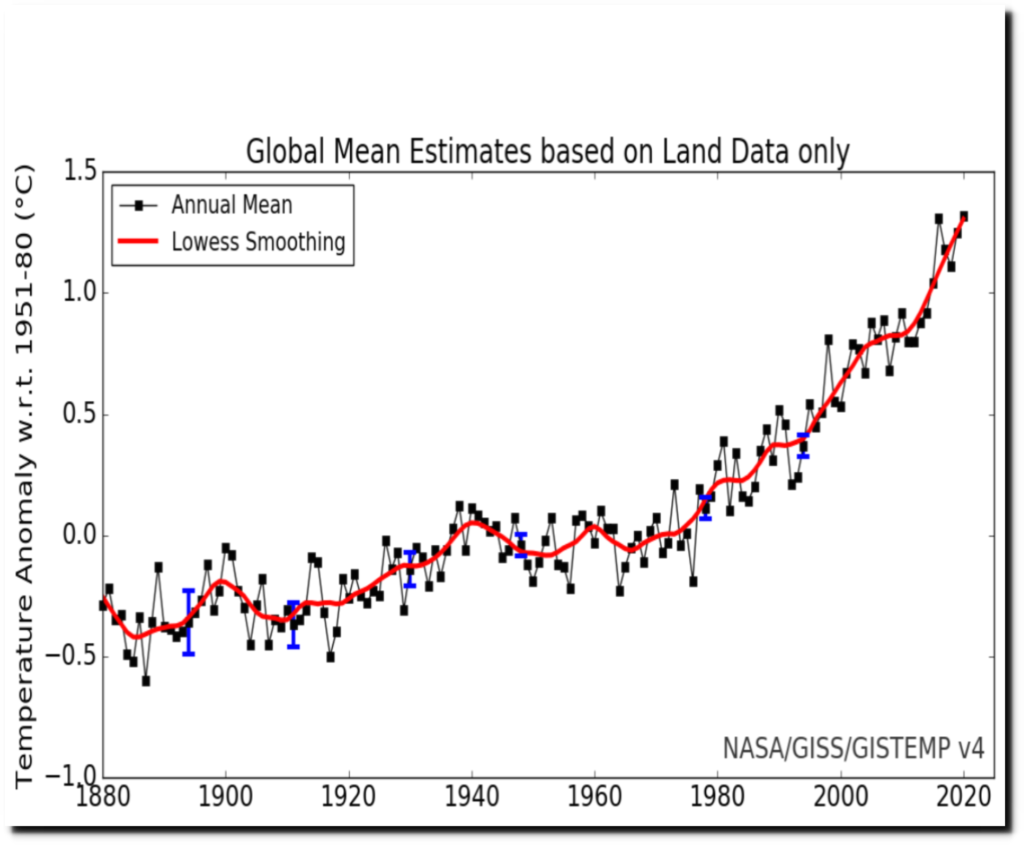
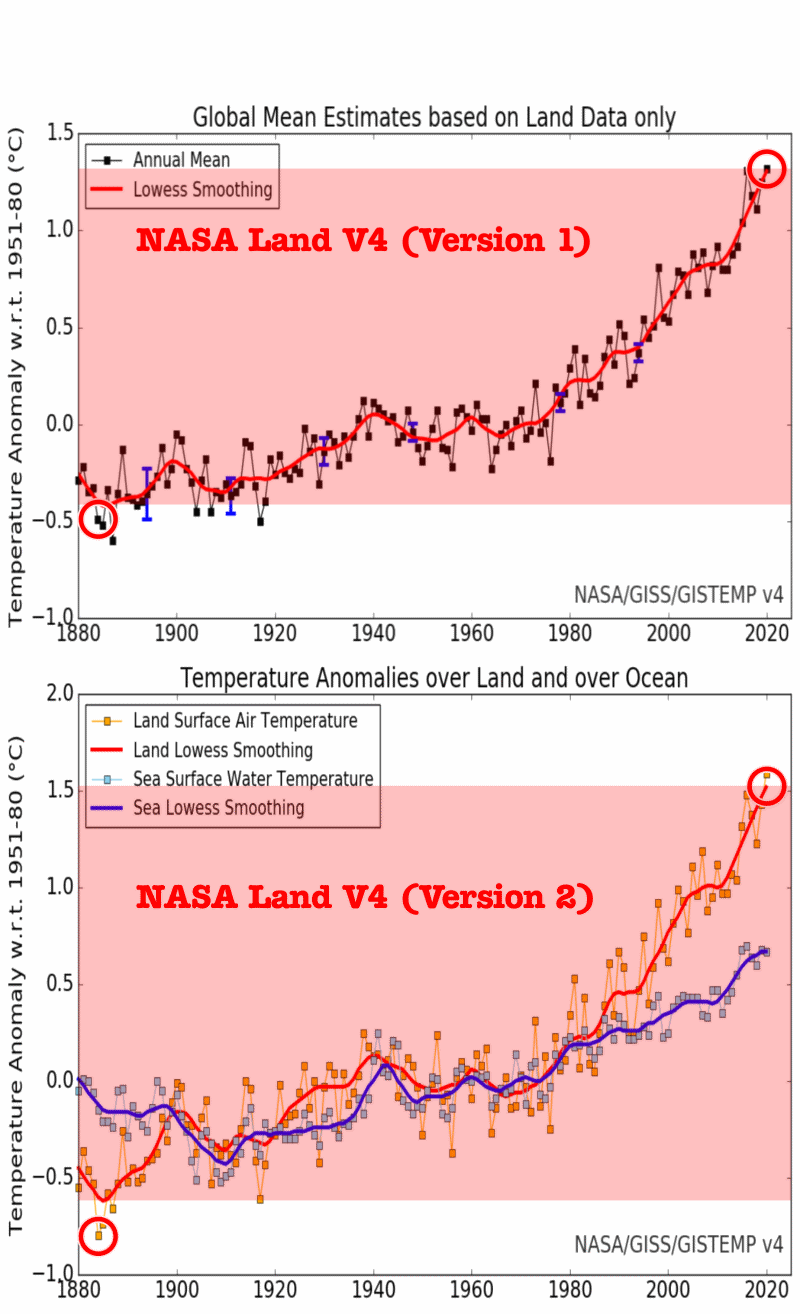
A different version of the same V4 graph also shows about 1.6C warming over land since 1880. This graph used to be linked to from their website, but I can no longer find any links. However the graph is still present on their website.
The red lines in both of the graphs above should be identical, but they aren’t. Here is an animation showing how they are altering the land data in the new graph vs. the old graph. They have increased recent temperatures by about 0.3C and cooled past temperatures by about the same amount.
In 2001, NASA published the same graph showing half as much warming from 1880 to 2000.
2001: Fig.A.ps
This animation cycles through how NASA has altered the data over the past 20 years to greatly increase warming.
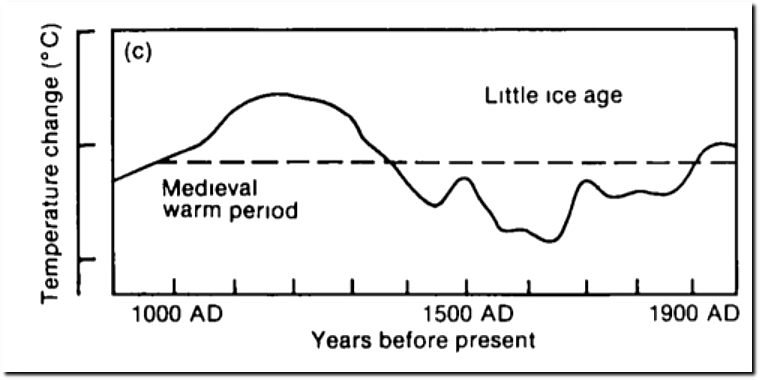
Let’s look now at why the data is being altered. In 1990, the IPCC showed no indication of man-made global warming and that current temperatures were just about average for the past thousand years.
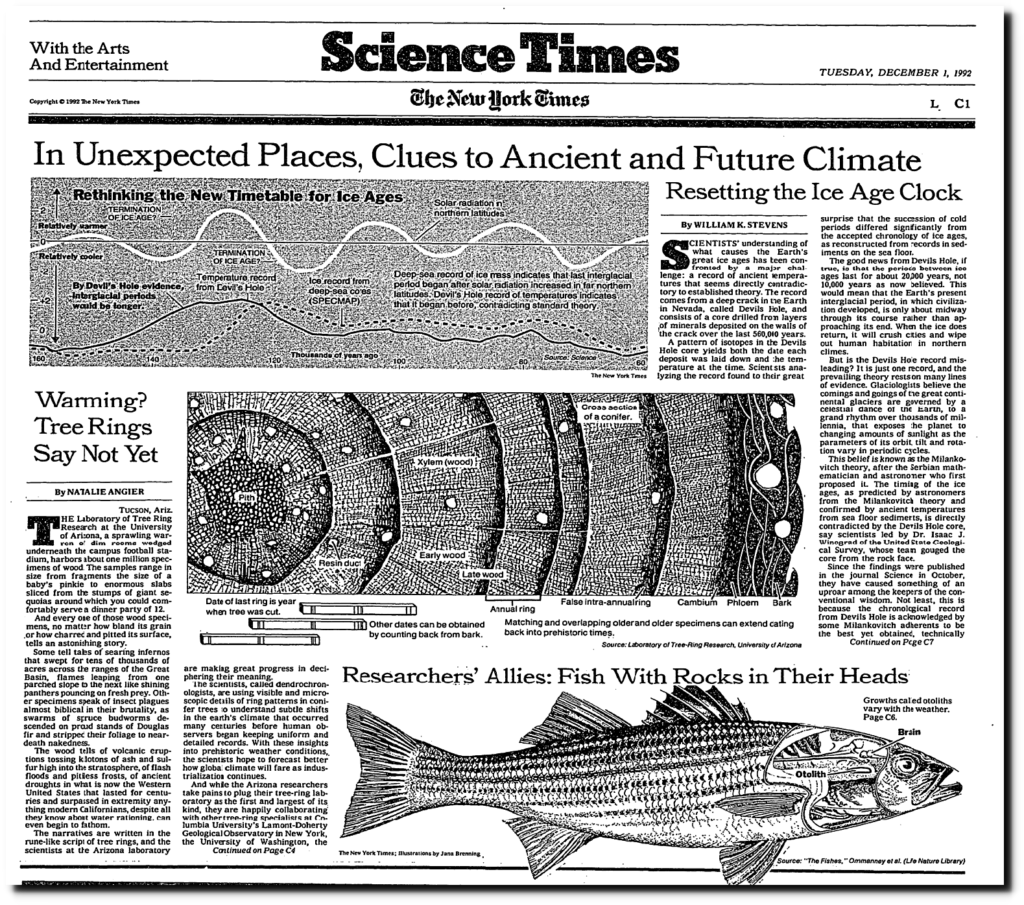
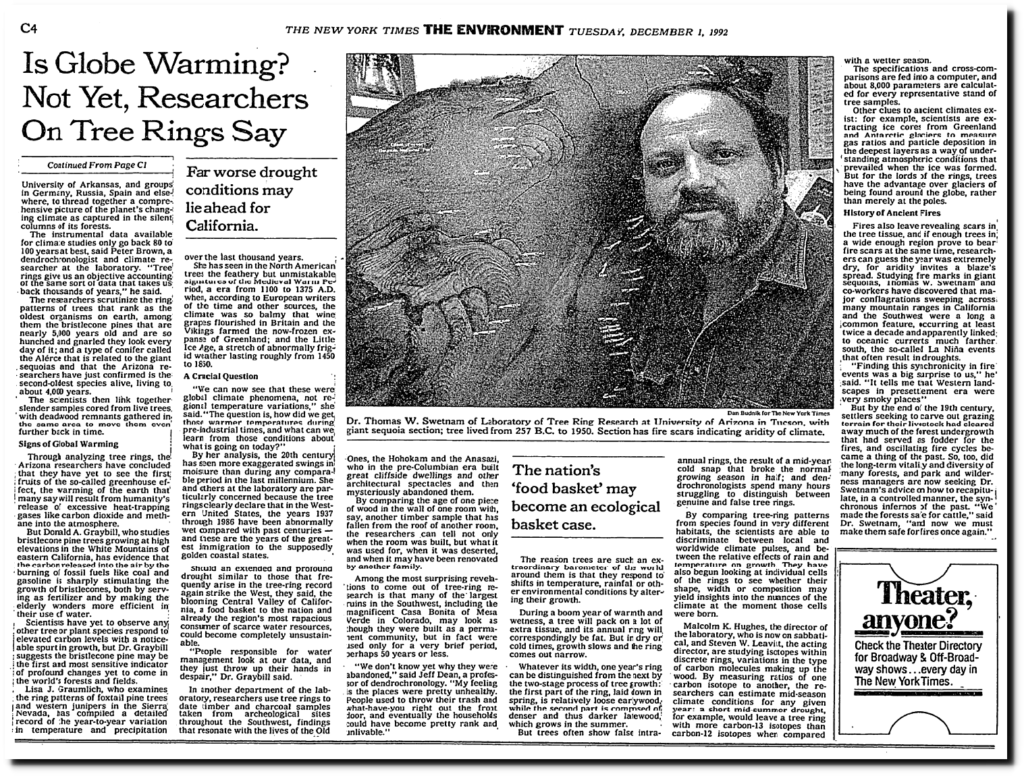
In 1992, the New York Times said there was no indication of global warming and that the MWP and LIA were global.
Warming? Tree Rings Say Not Yet
Lisa J. Graumlich, who examines the ring patterns of foxtail pine trees and western junipers in the Sierra Nevada, has compiled a detailed record of the year-to-year variation in temperature and precipitation over the last thousand years.
She has seen in the North American trees the feathery but unmistakable signatures of the Medieval Warm Period, a era from 1100 to 1375 A.D. when, according to European writers of the time and other sources, the climate was so balmy that wine grapes flourished in Britain and the Vikings farmed the now-frozen expanse of Greenland; and the Little Ice Age, a stretch of abnormally frigid weather lasting roughly from 1450 to 1850. A Crucial Question
“We can now see that these were global climate phenomena, not regional temperature variations,” she said. “The question is, how did we get those warmer temperatures during pre-industrial times, and what can we learn from those conditions about what is going on today?”
Al Gore was elected VP in 1992, and he was determined to change things.
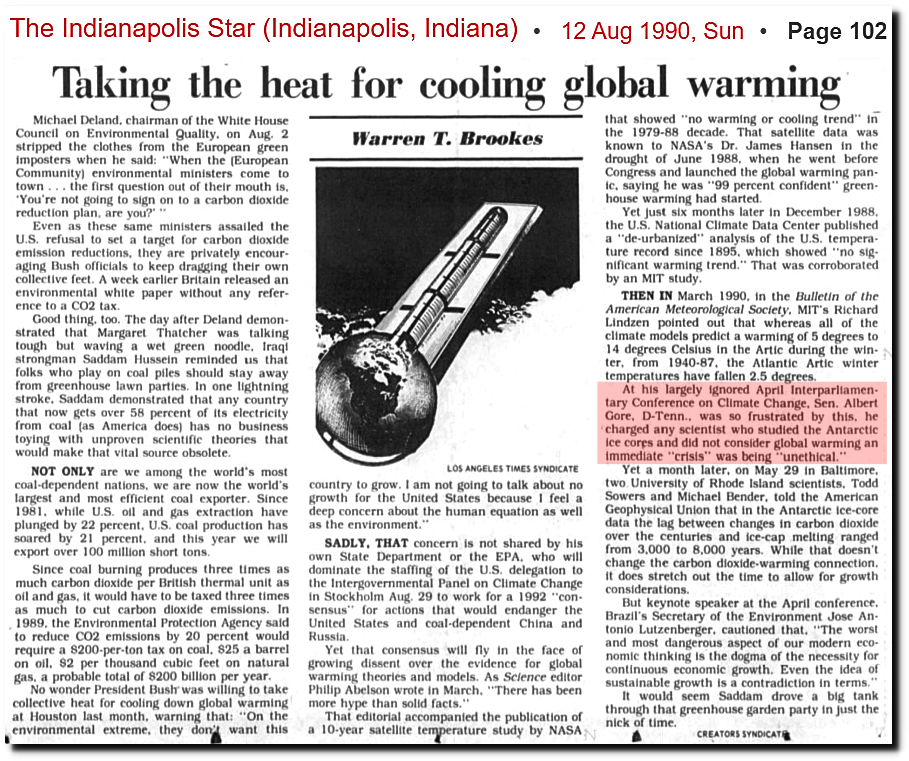
“any scientist who studied the Antarctic ice cores and did not consider global warming an immediate “crisis” was being “unethical.”
- Al Gore 1990
12 Aug 1990, Page 102 – The Indianapolis Star at Newspapers.com
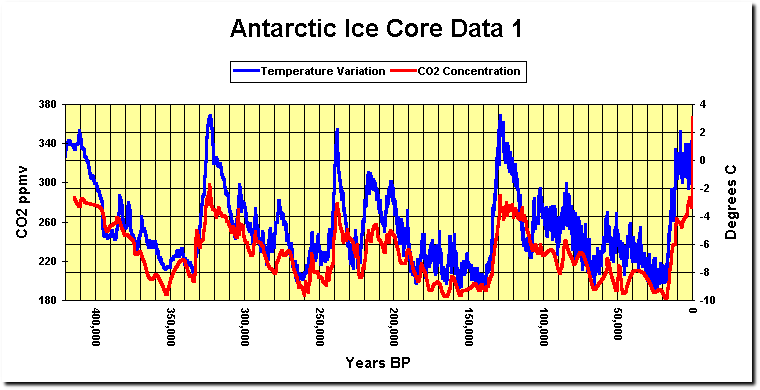
He misinterpreted Antarctic ice core graphs to show CO2 drove ocean temperature rather than the opposite. Under his model, a 100 PPM change in CO2 caused a 10C swing in temperature.
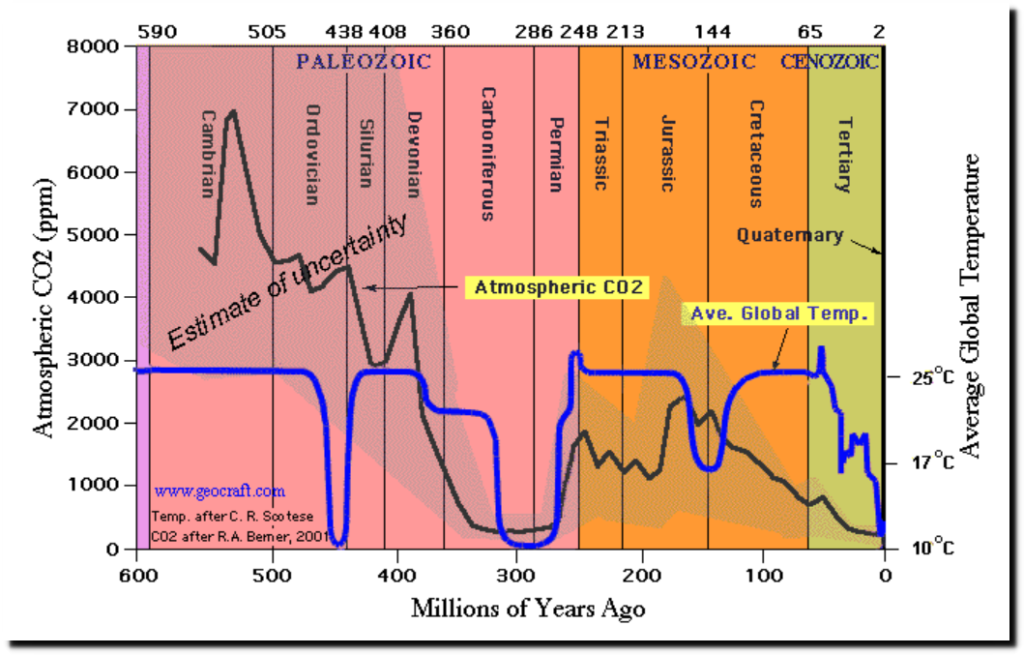
If that was the case, the 7,000 PPM of the Cambrian Era would have produced Antarctic temperatures of 700C.
Here’s a better graph of CO2 and temperature for the last 600 million years! | by G Horner | Medium
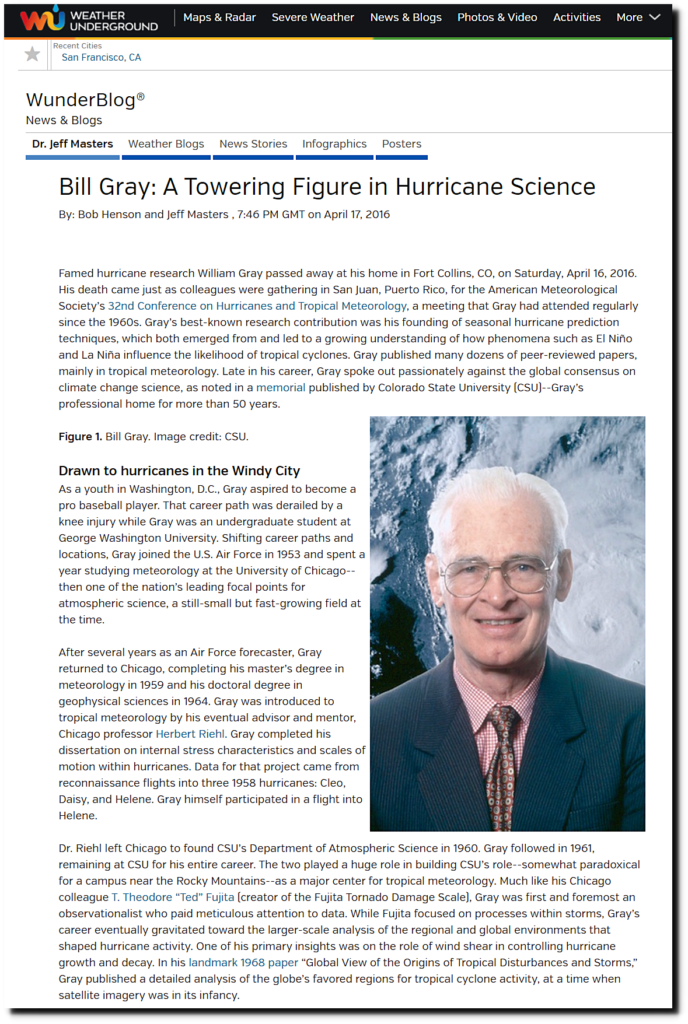
Science went out the window in 1992, and in 1993 my good friend Dr. Bill Gray – who was considered the world’s leading tropical meteorologist and the inventor of modern hurricane forecasting – received a phone call from VP Gore requesting his attendance at a global warming meeting Gore was having. Bill said he “would be happy to attend but was not a believer in Gore’s global warming apocalypse theories.” Dr. Gray immediately got his finding cut off and never received another penny from the government. Bill passed away five years ago this week and largely self-funded his research and his graduate students’ research from 1993 to 2016.

Everyone in the climate science community became aware that ongoing funding depended on towing the global warming line. Here he is with his Al Gore $8 bill.
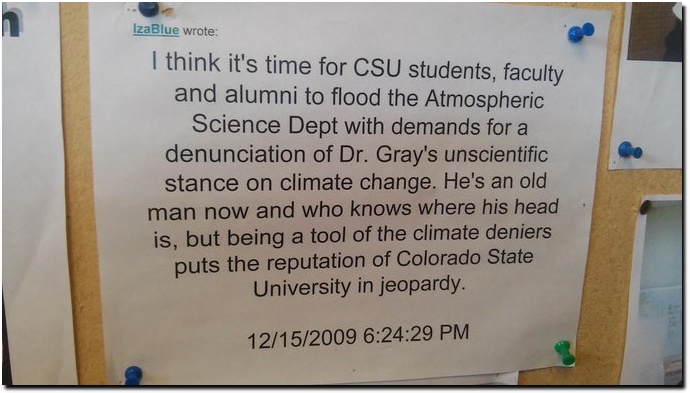
Bill never gave an inch to climate fraudsters even when attacked by Judith Curry and her husband Peter Webster.
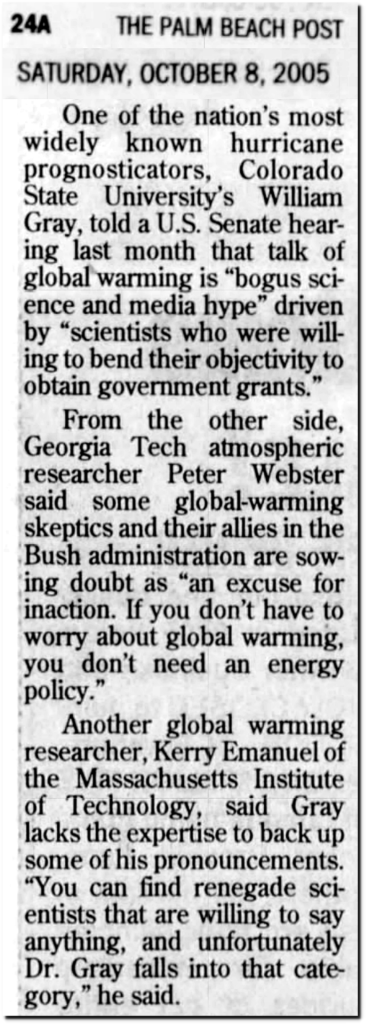
“CSU’s William Gray, told a U.S. Senate hearing last month that talk of global warming is “bogus science and media hype” driven by “scientists who were willing to bend their objectivity to obtain government grants.”
08 Oct 2005, Page 9 – The Palm Beach Post at Newspapers.com
When Bill passed away five years ago, even the climate alarmists at Weather Underground acknowledged his tremendous accomplishments, though they have since deleted this post.
Bill Gray: A Towering Figure in Hurricane Science | Dr. Jeff Masters’ WunderBlog
But climate science became hopelessly corrupt as soon as Al Gore took office. He was under constant attack for telling the truth and thus threatening university funding.
By 1995, climate science and climate journalism was hopelessly corrupt.
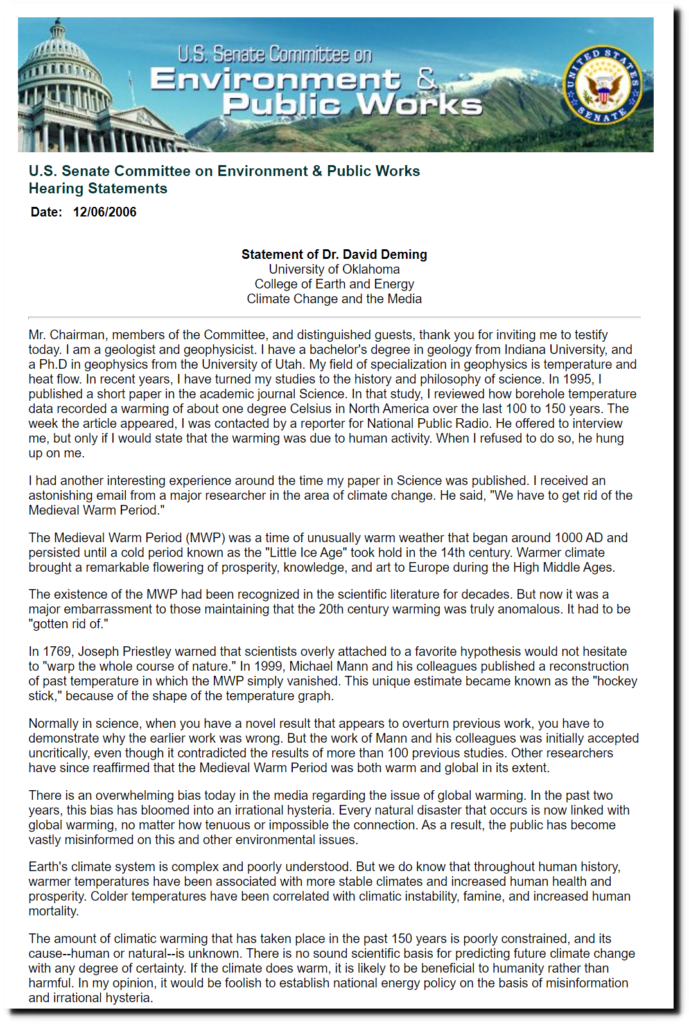
“In 1995, I published a short paper in the academic journal Science. In that study, I reviewed how borehole temperature data recorded a warming of about one degree Celsius in North America over the last 100 to 150 years. The week the article appeared, I was contacted by a reporter for National Public Radio. He offered to interview me, but only if I would state that the warming was due to human activity. When I refused to do so, he hung up on me.”
“I had another interesting experience around the time my paper in Science was published. I received an astonishing email from a major researcher in the area of climate change. He said, “We have to get rid of the Medieval Warm Period.”
“it would be foolish to establish national energy policy on the basis of misinformation and irrational hysteria.”
- Dr David Deming
U.S. Senate Committee on Environment and Public Works
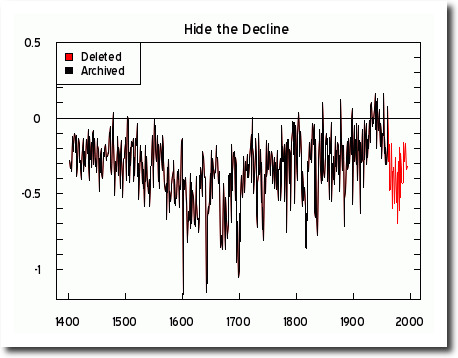
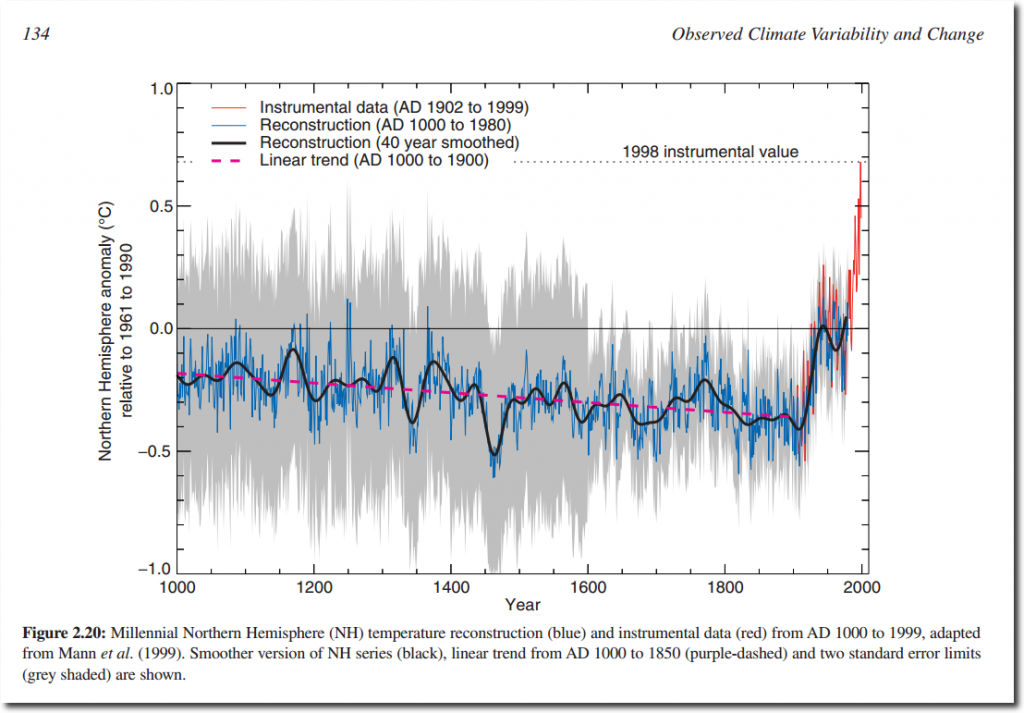
And three years later, Michael Mann hid the decline and made the Medieval Warm Period, Little Ice Age and post-1940 cooling disappear. He replaced the proxy data which showed cooling after 1940 with fake global temperature data from NASA and NOAA.
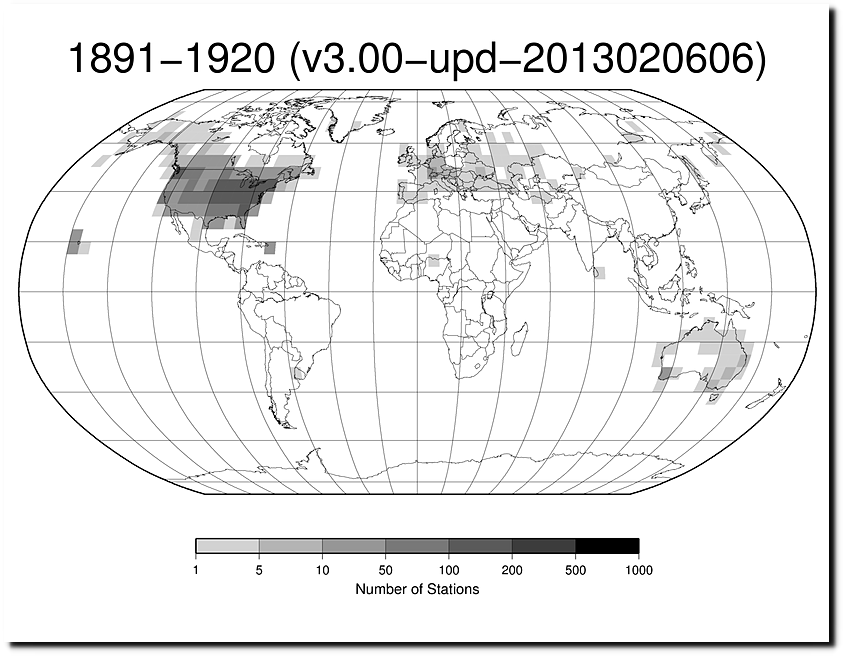
The United States temperature record is particularly important, because the vast majority of high quality long-term temperature data around the world are in the US.
station-counts-1891-1920-temp.png
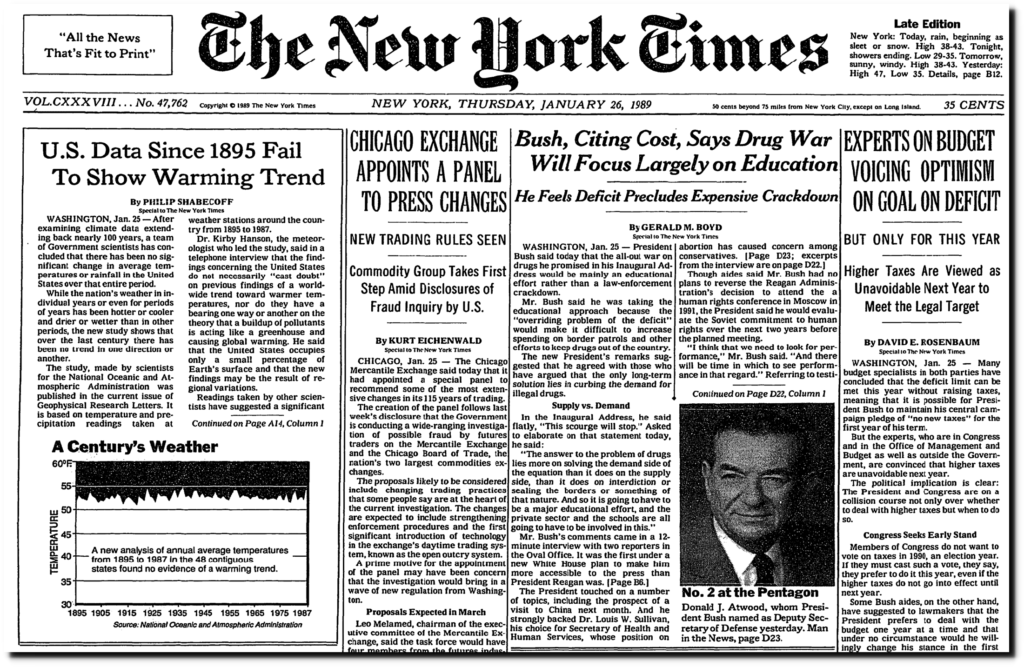
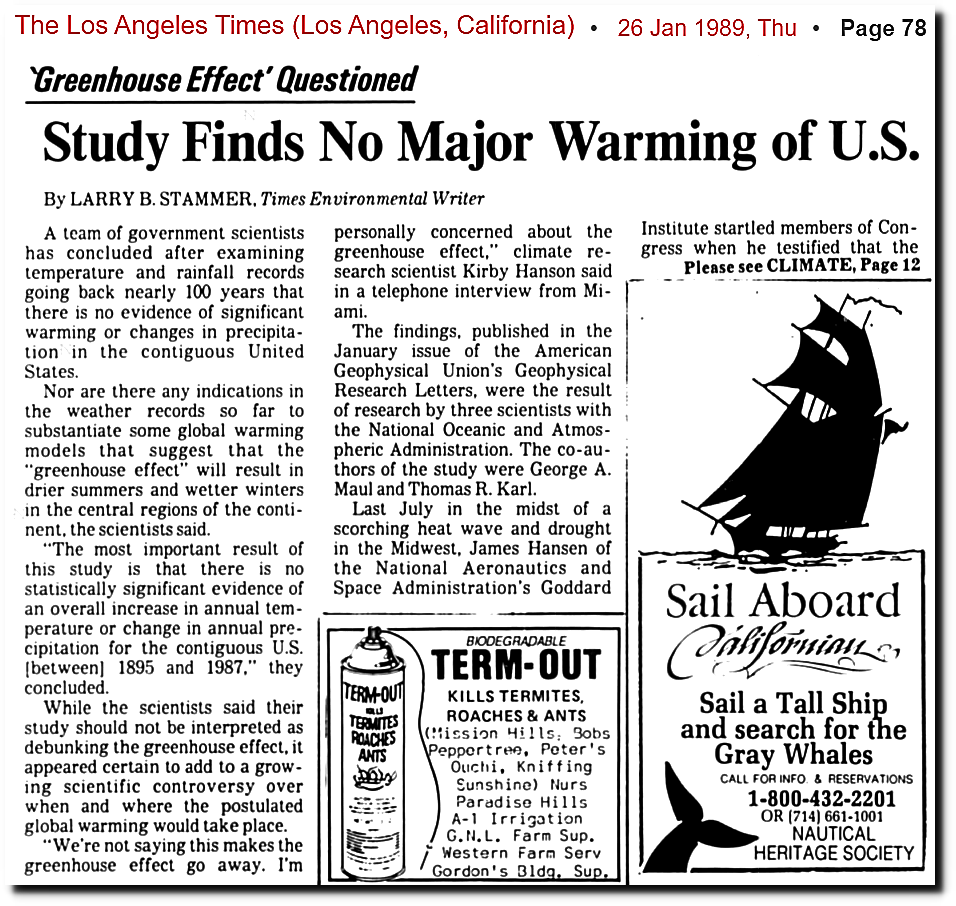
In 1989, NOAA’s Tom Karl said there had been no warming in the US over the past century, and no indication the greenhouse effect had affected temperatures. He directly contradicted NASA’s James Hansen’s 1988 testimony before Congress.
U.S. Data Since 1895 Fail To Show Warming Trend – NYTimes.com
26 Jan 1989, 78 – The Los Angeles Times at Newspapers.com
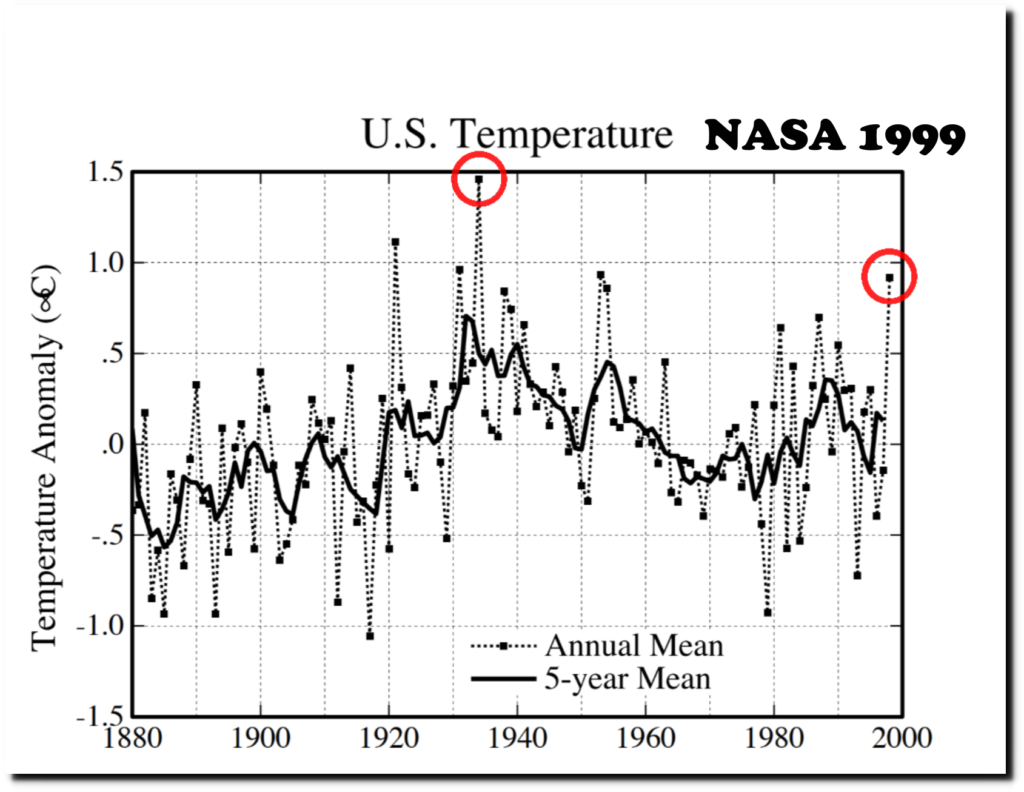
This graph of US temperatures was posted by NASA in 1999, showing a strong cooling trend from the 1930’s through the end of the century. The years 1934 and 1998 are circled.
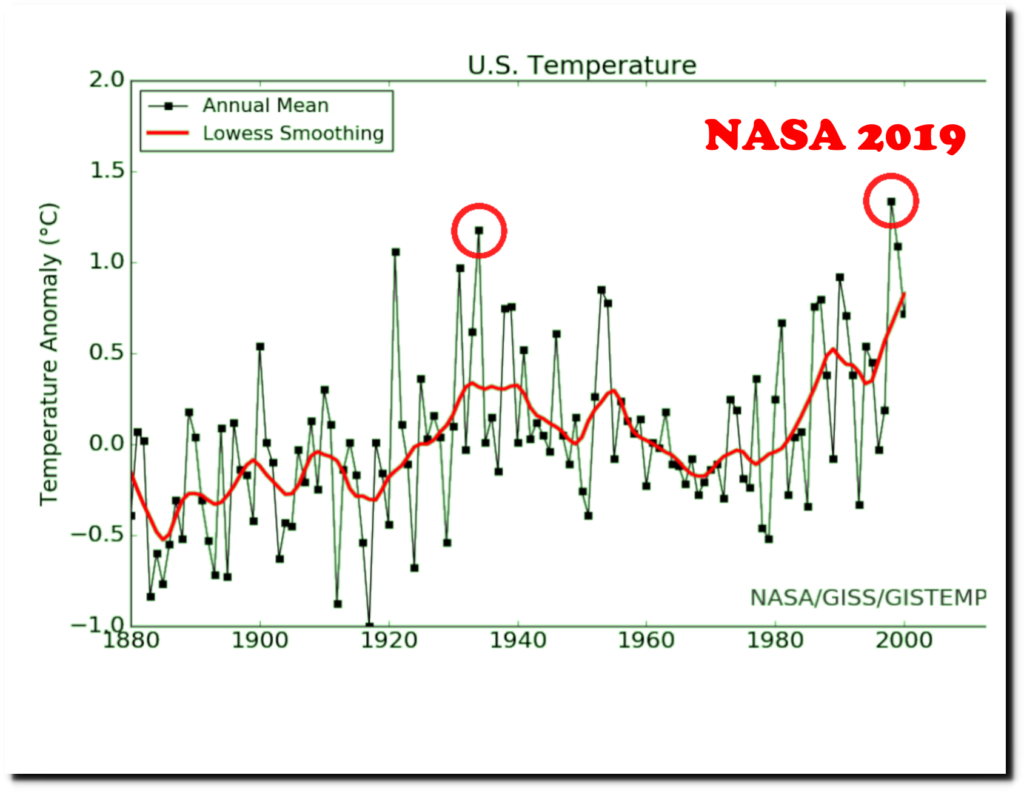
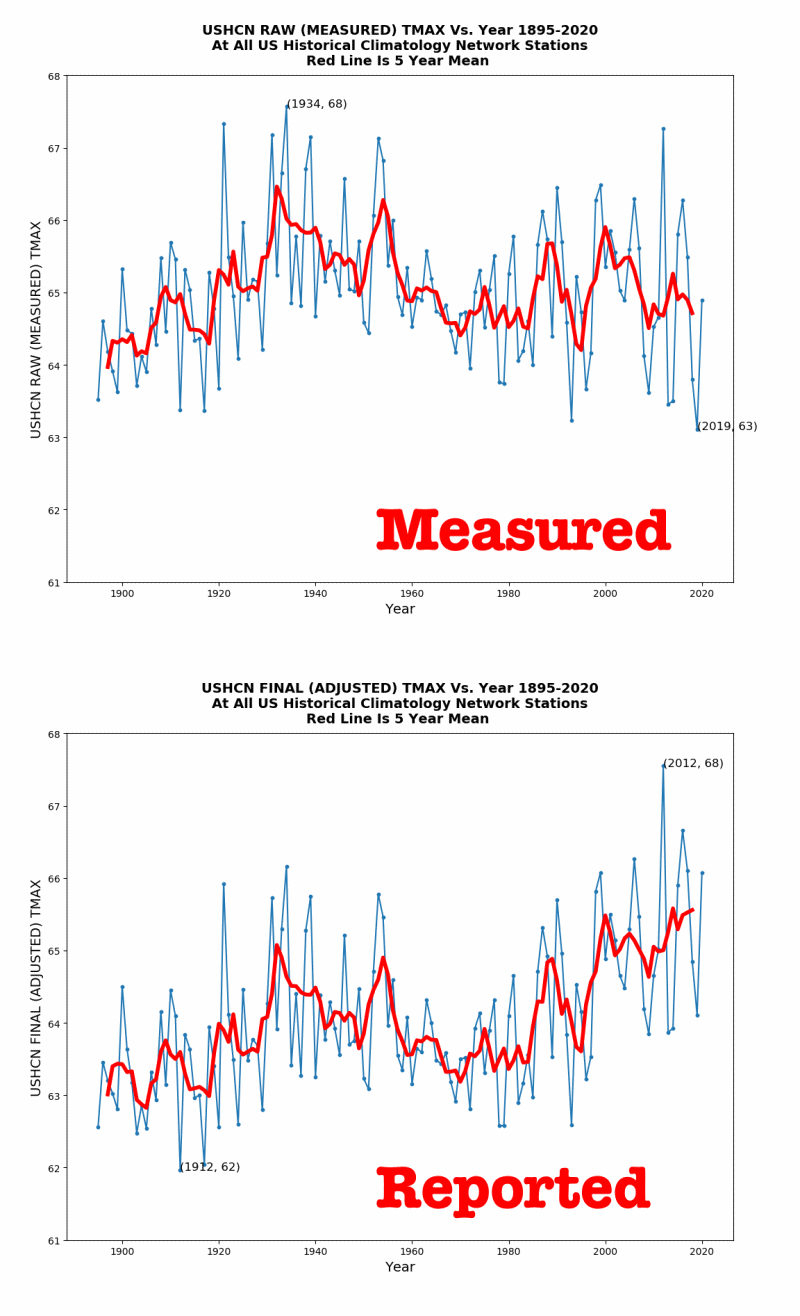
But NASA and NOAA changed the data after 1999 to reverse the trend.
Here is an animation showing how the data has been altered over the past 20 years.
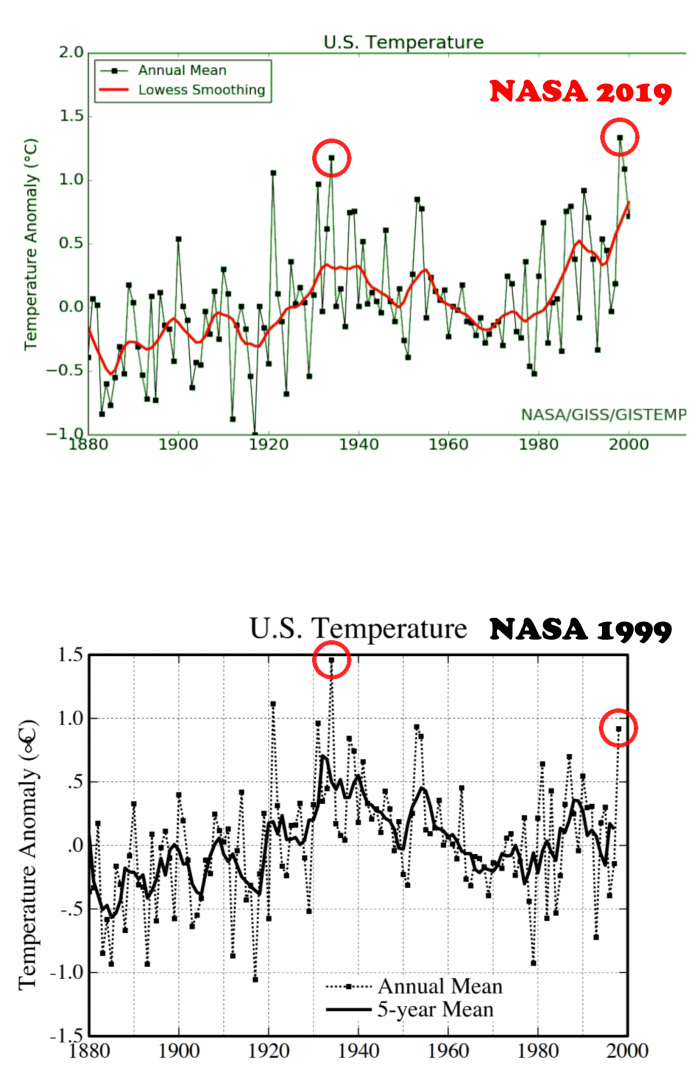
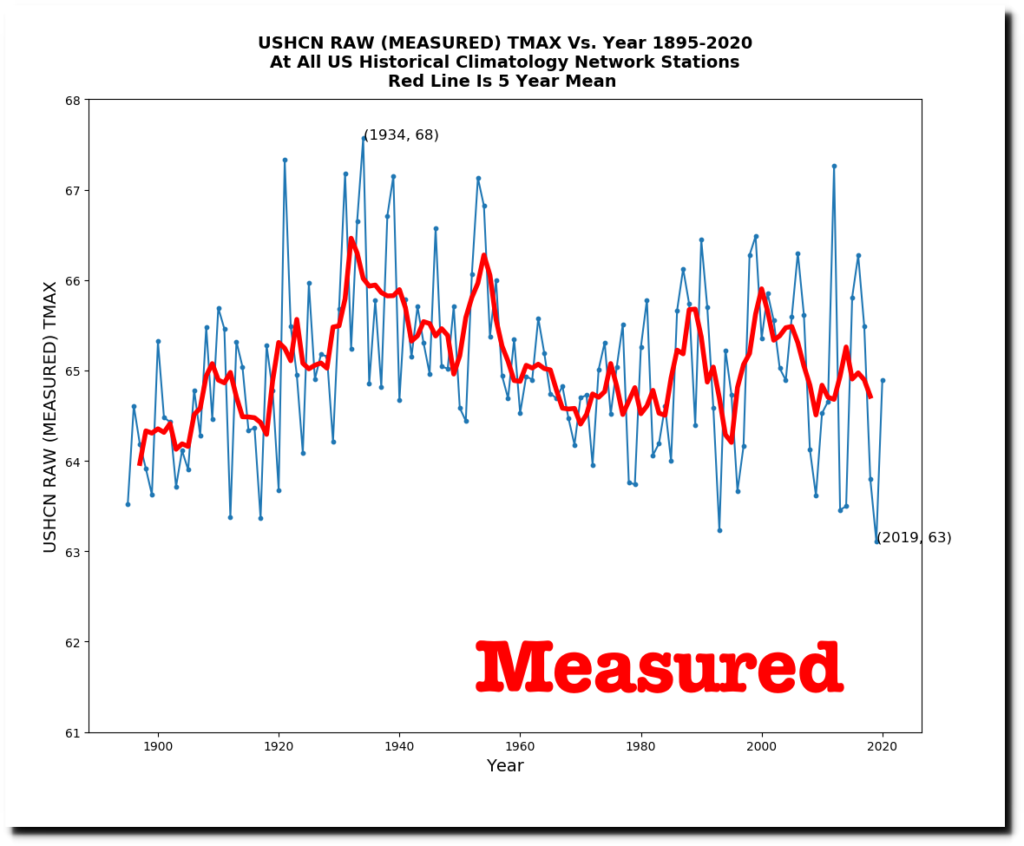
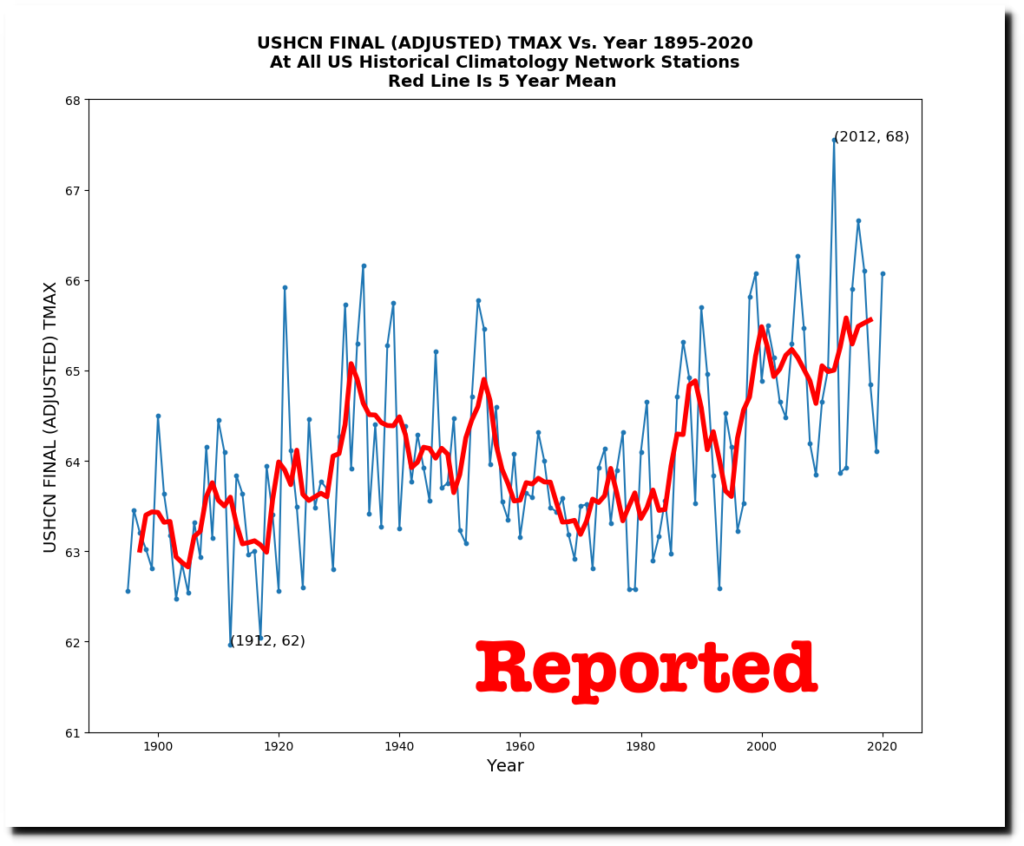
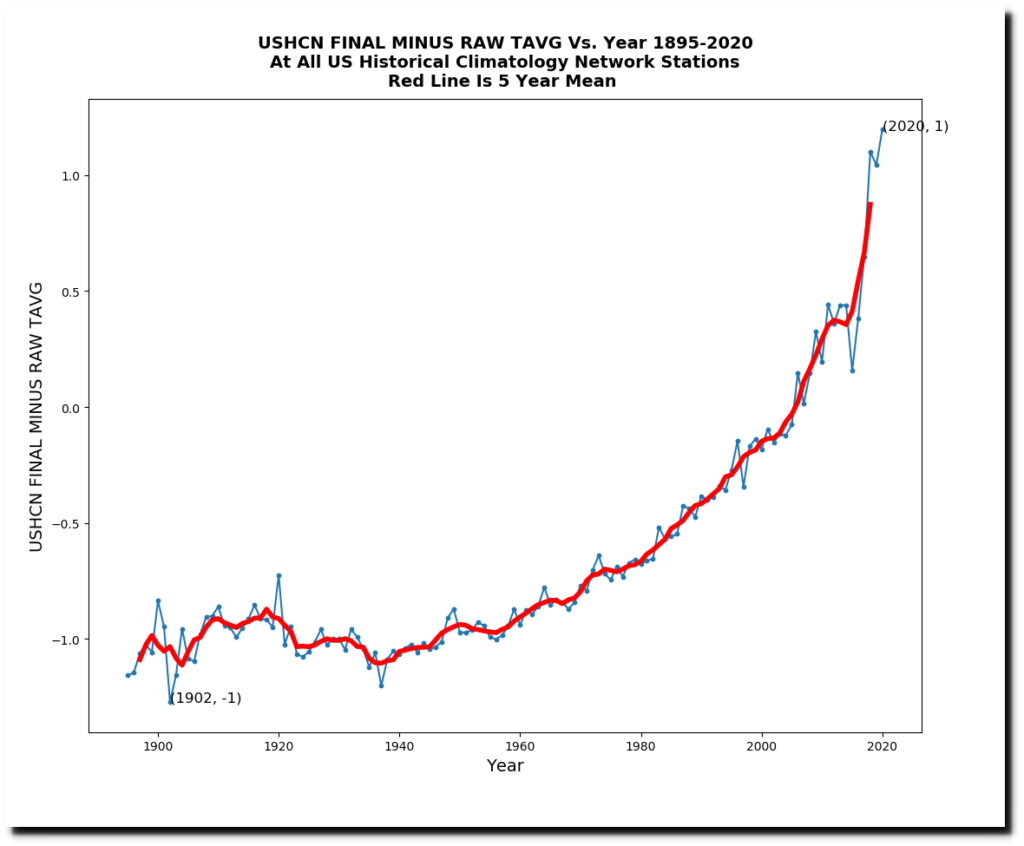
Data from NOAA is being altered to turn a cooling trend into a warming trend.
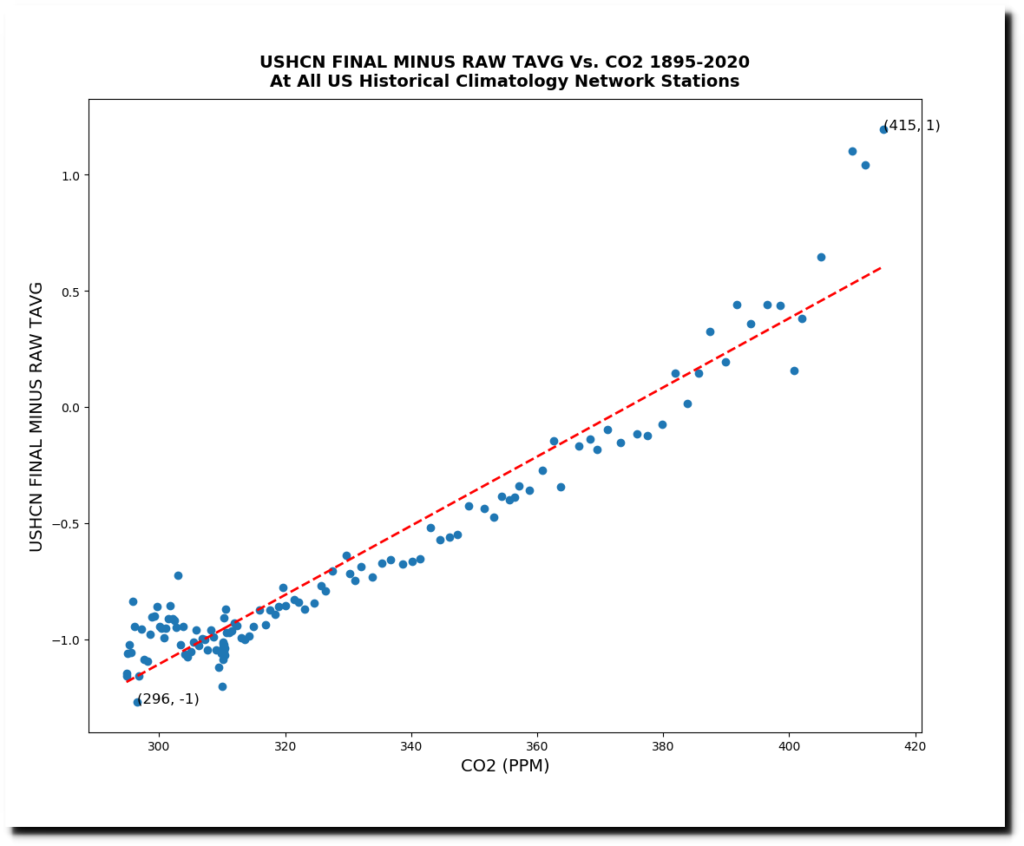
The hockey stick of data tampering is being done precisely to match the increase in CO2 – which is the same story as is being done with the global temperature record.
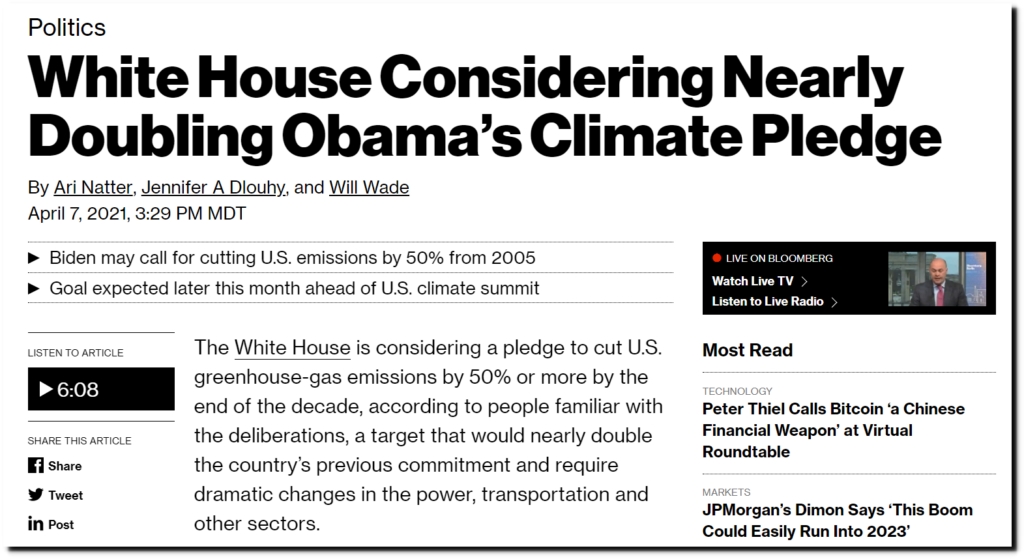
So why is this being done? Apparently a decision was made decades ago by people who wanted to shut down the US energy supply to link CO2 and climate. Now that that has been done, Joe Biden is actually shutting down the US energy supply.
White House Considering Nearly Doubling Obama’s Climate Vow – Bloomberg
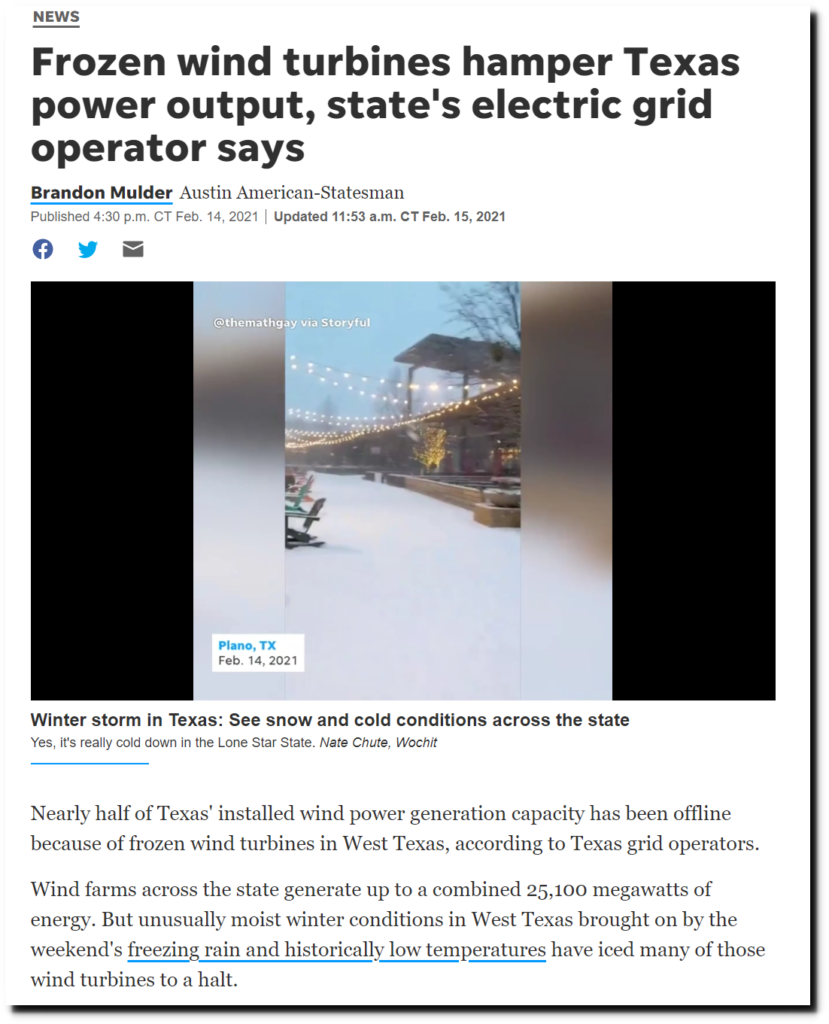
A lot of people froze to death in Texas during February because the state chose to rely on green energy.
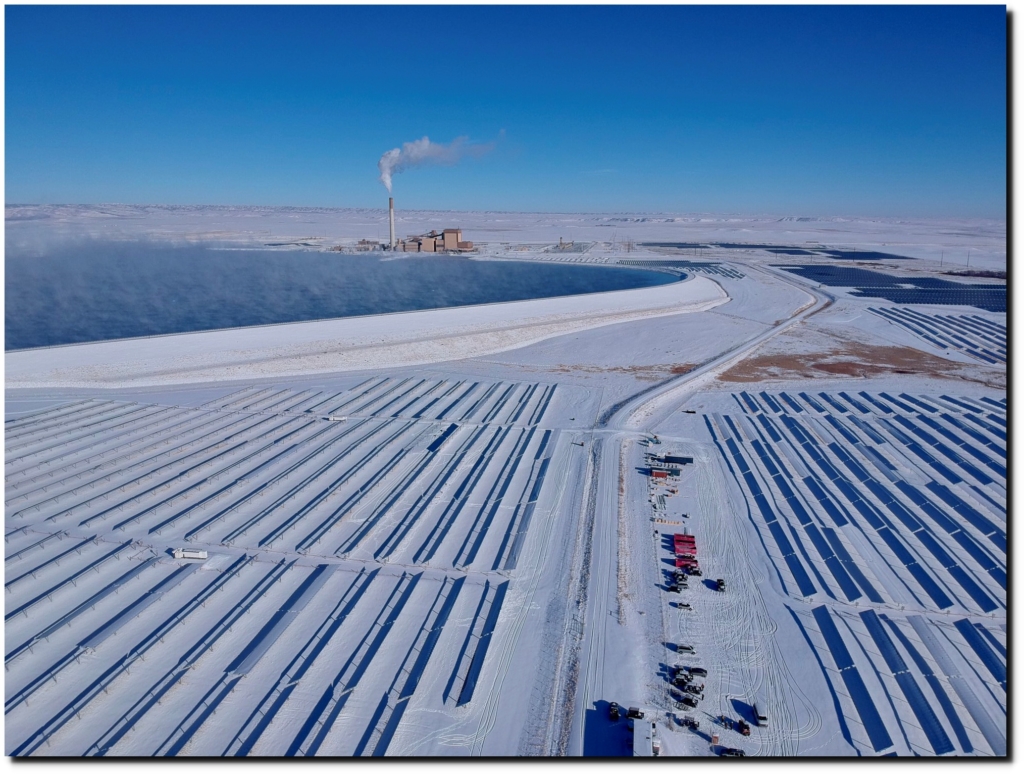
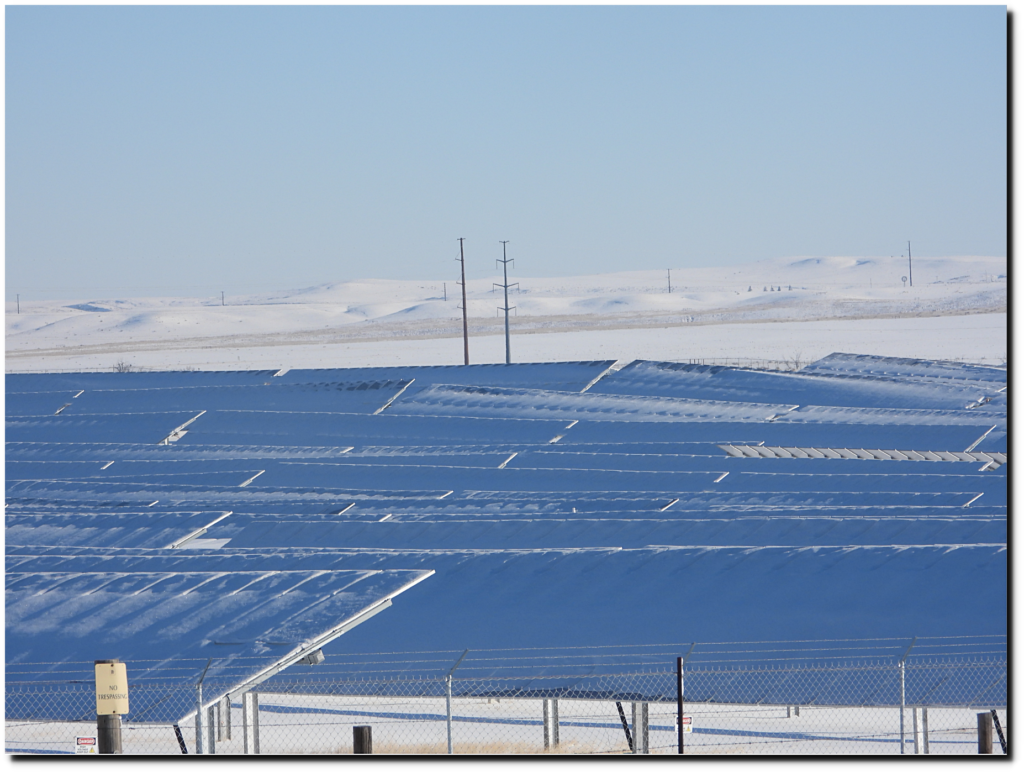
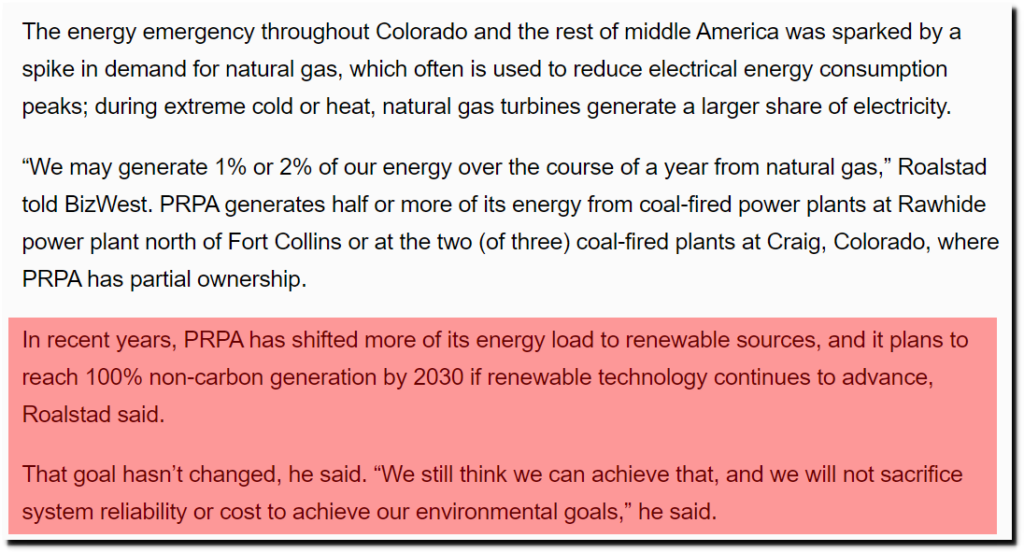
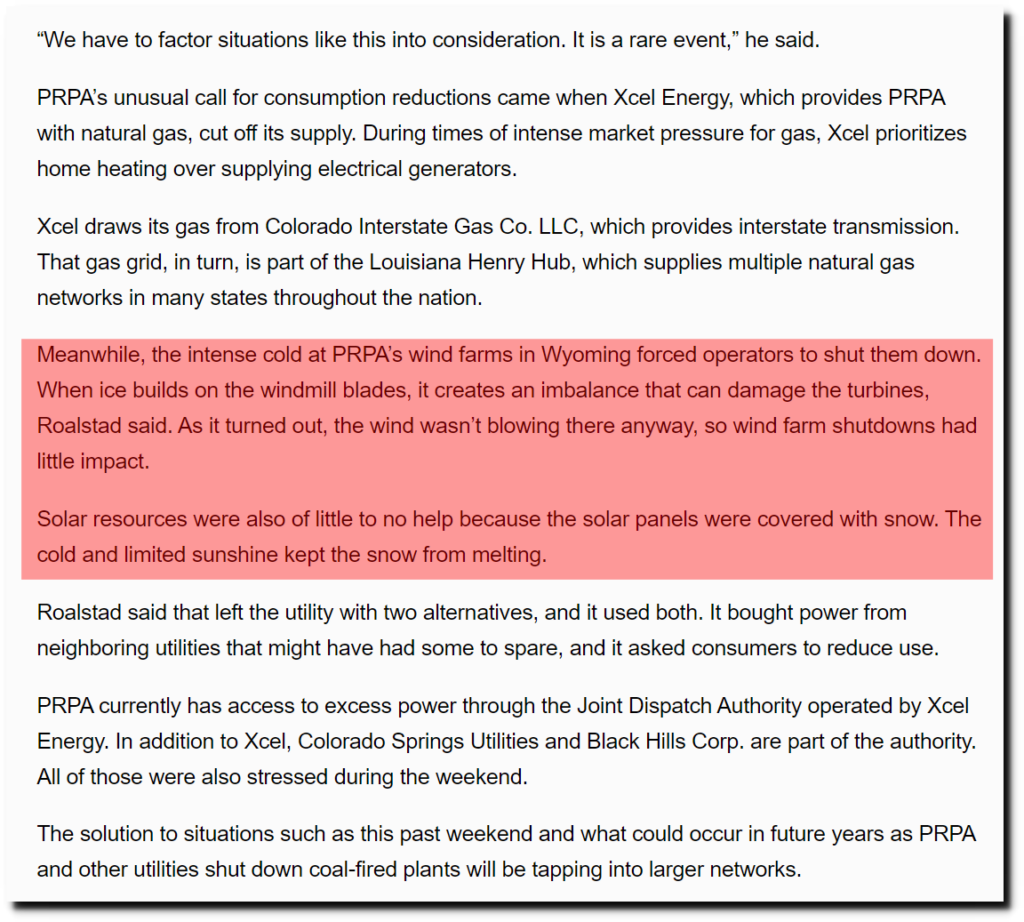
The same thing would have happened in Colorado, but they had other more responsible states like Wyoming to provide their electricity for them. We had our coldest late winter day on record on Valentines Day in Cheyenne. Wyoming when the temperature never got above -7F (-22C.) This is what the Rawhide Coal Fired Power Plant and solar panels looked like across the border in Colorado. The state is panning on shutting down the coal plant in the next few years, despite the fact that most of Northern Colorado was depending on it for their survival.
“In recent years, PRPA has shifted more of its energy load to renewable sources, and it plans to reach 100% non-carbon generation by 2030
the intense cold at PRPA’s wind farms in Wyoming forced operators to shut them down. When ice builds on the windmill blades, it creates an imbalance that can damage the turbines, Roalstad said. As it turned out, the wind wasn’t blowing there anyway, so wind farm shutdowns had little impact. Solar resources were also of little to no help because the solar panels were covered with snow. The cold and limited sunshine kept the snow from melting.
Roalstad said that left the utility with two alternatives, and it used both. It bought power from neighboring utilities that might have had some to spare, and it asked consumers to reduce use.
The solution to situations such as this past weekend and what could occur in future years as PRPA and other utilities shut down coal-fired plants will be tapping into larger networks.”
PRPA: Cold snap accentuates importance of energy networks – Loveland Reporter-Herald
Colorado is planning on being bailed out of their irresponsible behavior by Wyoming and Nebraska, but a national mandate from the White House would cause almost everyone to freeze to death next time this happens.
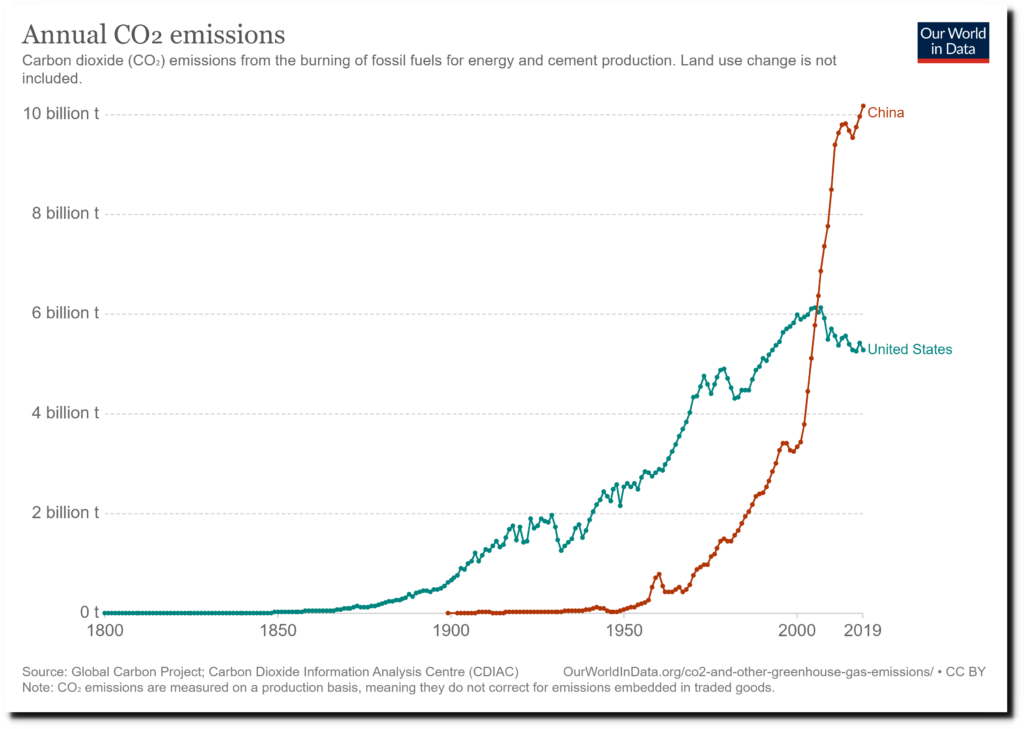
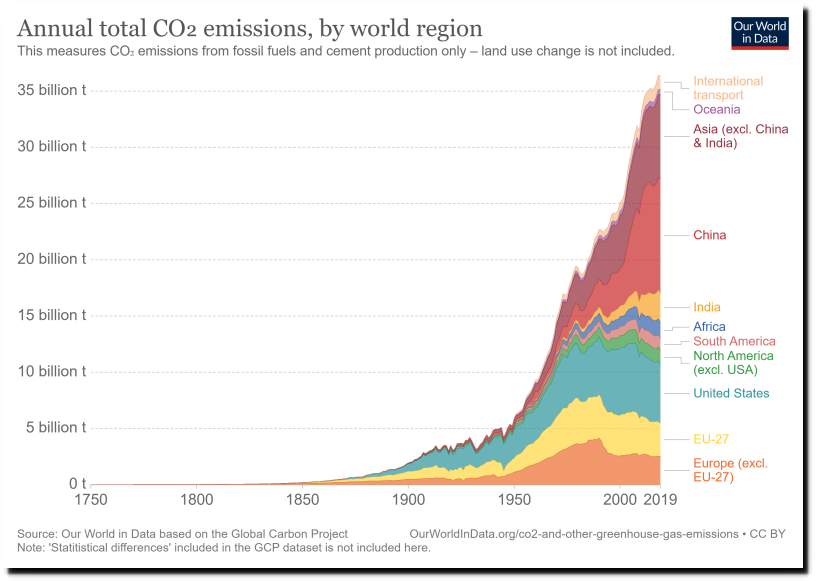
US CO2 emissions have been declining for 15 years, as China’s have skyrocketed. The US could disappear off the map and it would have almost impact on atmospheric CO2.
CO? and Greenhouse Gas Emissions – Our World in Data
Even John Kerry admits that the US could drop off the map and it wouldn’t make any difference
.Kerry: Zero emissions won’t make difference in climate change
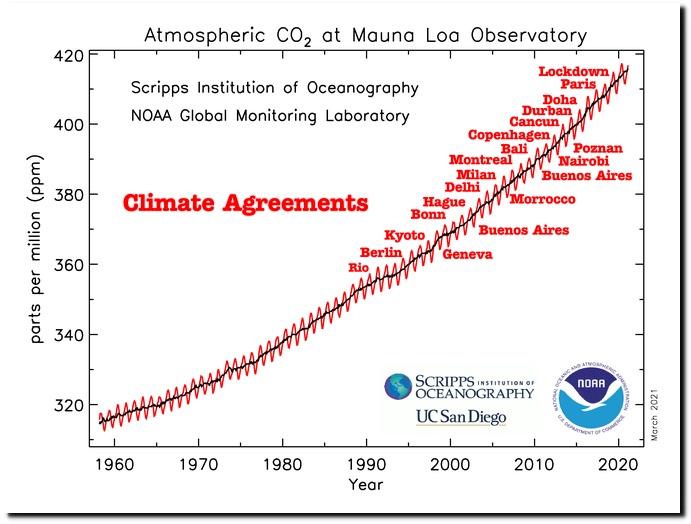
Governments don’t have any control of climate.
Global Monitoring Laboratory – Carbon Cycle Greenhouse Gases
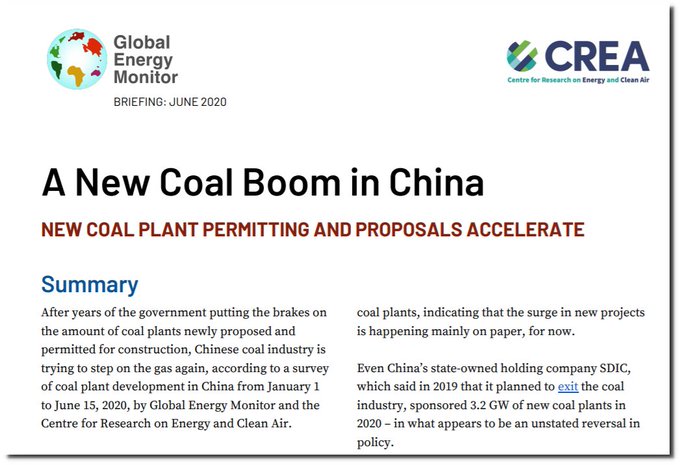
China is building a huge number of new coal fired power plants.
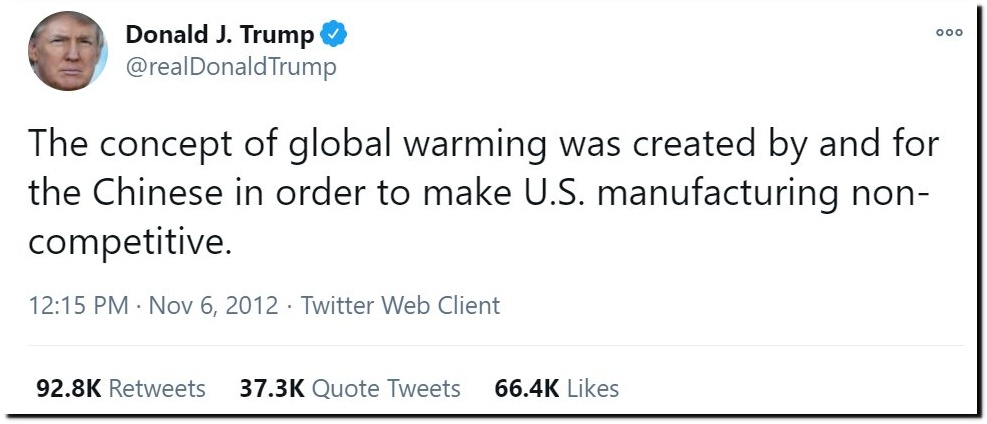
President Trump has understood what is going on for many years, which was one of the reasons for the coup against him and the across the board conspiracy by the press and social media to censor him.

