Disrupting the Borg is expensive and time consuming!
Google Search
-
Recent Posts
- Gaslighting 1924
- “Why Do You Resist?”
- Climate Attribution Model
- Fact Checking NASA
- Fact Checking Grok
- Fact Checking The New York Times
- New Visitech Features
- Ice-Free Arctic By 2014
- Debt-Free US Treasury Forecast
- Analyzing Big City Crime (Part 2)
- Analyzing Big City Crime
- UK Migration Caused By Global Warming
- Climate Attribution In Greece
- “Brown: ’50 days to save world'”
- The Catastrophic Influence of Bovine Methane Emissions on Extraterrestrial Climate Patterns
- Posting On X
- Seventeen Years Of Fun
- The Importance Of Good Tools
- Temperature Shifts At Blue Hill, MA
- CO2²
- Time Of Observation Bias
- Climate Scamming For Profit
- Climate Scamming For Profit
- Back To The Future
- “records going back to 1961”
Recent Comments
- conrad ziefle on Gaslighting 1924
- Robertvd on Gaslighting 1924
- conrad ziefle on Gaslighting 1924
- arn on Gaslighting 1924
- Gordon Vigurs on Gaslighting 1924
- Bob G on Climate Attribution Model
- conrad ziefle on Climate Attribution Model
- Ohio Cyclist on Climate Attribution Model
- Bob G on Climate Attribution Model
- Bob G on Climate Attribution Model
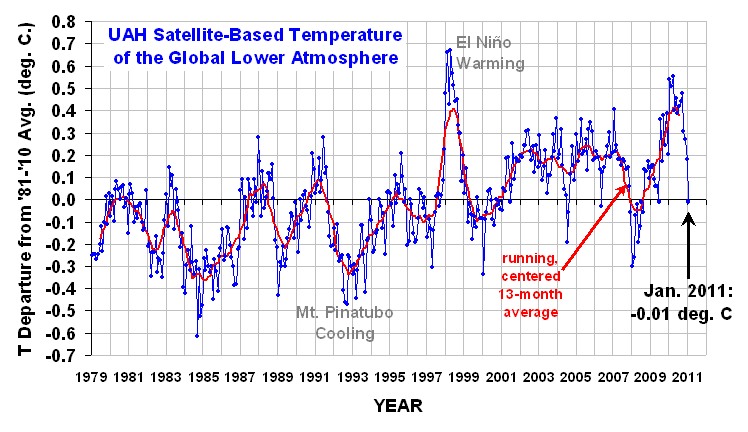
January Almost As Warm As Thirty Years Ago
This entry was posted in Uncategorized. Bookmark the permalink.


How can you look at yourself in the mirror when you publish lies?
It’s beyond belief.
Are you completely daft?
January 1981 0.02
January 2011 -0.01
glasater must have been joking
lol, Steve publishing lying satellite data! Wow, Steve, you sent that one straight to the denial stage!
Check out the HadCrut global temperature record :
http://www.cru.uea.ac.uk/cru/data/temperature/hadcrut3vgl.txt
December 2010 was cooler than February 1878!
It was a long lag between the cooling oceans and that layer of the atmosphere dropping. Also, why did it not decrease gently like the ocean temps decreased gently?
Andy
Steve (or anyone), you always seemed to be savvy on knowing how the temps are derived from various sources. Showing Doc Spencer’s last three months listed look how the global temp is way above any average I can come up with. Especially since the tropics is -0.369. Any ideas?
YR MON GLOBE NH SH TROPICS
2010 11 0.273 0.372 0.173 -0.117
2010 12 0.181 0.217 0.145 -0.222
2011 1 -0.009 -0.055 0.038 -0.369
Wayne, I don’t think you’re looking at the graph correctly. Doc Spencer has last month as below the average. Hence the value, “2011 1 –0.009″
If you could provide a link to where you’re getting the numbers, I’ll try to explain them, if I can.