
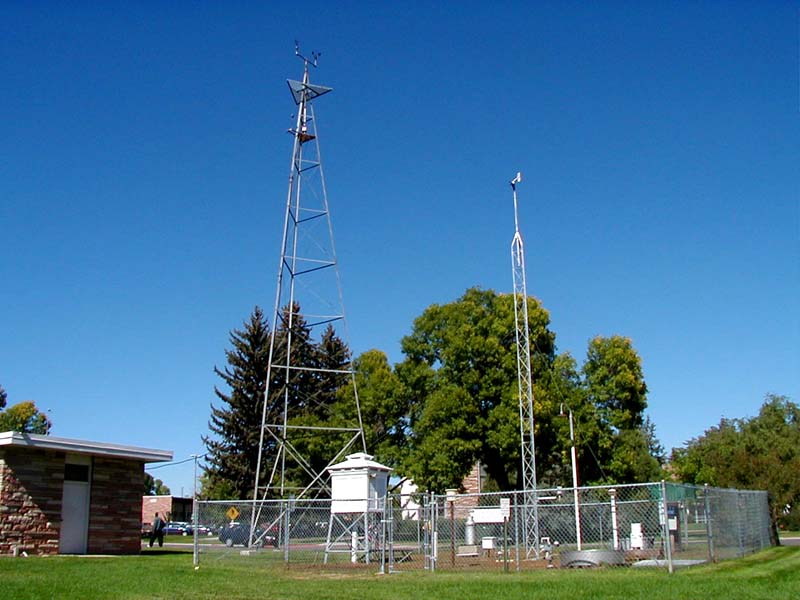
The Fort Collins weather station has been one of the most stable stations on the planet. It hasn’t moved and has used the same equipment for its entire history. The station shows several degrees warming over the last 100 years.

Photos of the station on the CSU web site show that it is well maintained. It must prove global warming!

What could possibly be wrong, other than the fact that the weather station is located in the middle of an asphalt bus station on the CSU campus?

I have a thermometer strapped to my bicycle. On clear, calm nights, I measure about six or seven degrees difference in Fort Collins between open space and neighborhoods.

The population of Fort Collins has quadrupled over the last 100 years. By contrast, Boulder’s population has been stable and shows cooling over the last 60 years.

Experts like Hansen tell us that UHI doesn’t matter, because they have absolutely no idea what they are talking about.

UHI destroys any warming trends established in the climate record, Hansen knows this and waves his hands to obscure the obvious truth. UHI is a huge distortion to the ‘average’ temperature, and dwarfs the .6C claim.
The “adjusted” data provided by Hansen, Jones and BEST (because it is also adjusted) is BS. Purposely reduced before and raised after. His majestic here has demonstrated this a zillion times. Spencer’s only believable data shows a binomial curve no warming
The temperature gradients near that thermometer are extreme. I learned that firsthand while on a run with a friend back in early September, 2010. Checking online before a late-afternoon run, it claimed it was 89 F. Walking outside, it was clear that wasn’t true and was much cooler. So we took off and ran several miles along the Poudre trail. We then cut through town and went down the main strip at CSU, probably 0.2 miles east of the temperature station shown above. It was miserably hot there, much hotter than anywhere else on our run despite getting later in the evening and approaching sunset. We continued south and as soon as we got to a more residential neighborhood we dropped several degrees F. A little further south and we hit the Spring Creek trail and it was at least 10 F cooler than on campus, maybe 20 F. The difference was absurd, and our pace picked up dramatically.
To be fair, the Spring Creek trail was probably cooled by evaporative cooling of the creek, but I’m still guessing that just the normal neighborhood area was 5-10 F cooler than near the station, despite all the asphalt in that neighborhood too.
If climate scientists don’t believe in UHI, then have them go on a run in the summer starting outside of town, through town, and then leaving town. They’ll be believers soon enough…assuming they survive the run!
-Scott
One afternoon last summer I rode down the Spring Creek Trail, and then cut up across campus to old town. It was about 10 degrees warmer at Mountain and College (95F) than it was along the trail (85F.)
I have a similar experience Steven. At work, our parking lot is on the top of a long flat east-to-west ridge. The temperature can vary by 10-20 degrees F when comparing north rim to south rim. Same altitude throughout. At night the temperatures converge, during the day there is wide separation.
Hey Scott! There is a good reason why the over 40 rural male demographic is the least likely to fall for AGW, we experience first hand the difference between city heat and rural warmth. When I walk out my front door at home at noon in July, it is a completely different experience than when I walk out of my office. I see my thermometer at home, while watching the weather man give me readings from the international airport, and find that the city folk live in a different climate. To deny this is to be a denier.
And by the way, under 40 urban dwellers are the most likely to fall for AGW. They need to get out more…
And Steve – that 47 F you measured is near the (new?) fire station…I wonder if it’d be even cooler without that fire station?
-Scott
Hey guys, here in the northwest corner of Oregon we know about the state of the climate also. In the fall of 2007 I ate a newton pippon apple that ripened beautifully here on our small farm, it colored light yellow with the pretty purple stripes and had that delicous hint of pine that makes it one of the best apples in the world. Due to the cooling since then I’ve not eaten a perfectly ripened newton pippon since. And the last two years even our braeburns are not experiencing enough warmth to ripen well. We have in the last two years begun planting earlier varieties. To hear the warmists talk we should be thinking about planting bananas.
It used to be that the UHI affect was mostly a nighttime thing, especially during clear, calm nights.
Now I am noticing that Reagan National (near DC) can be 2-4 degrees warmer than surrrounding stations even during the daytime, with a breeze. It didn’t used to be that way. I smell a rat. Would you trust NOAA not to warm bias stations one way or another? I don’t trust them a bit, with such
big money and a huge political agenda at stake.
Wow, all of you are cynics and skeptics. You must accept the conclusion that the UHI effect does not exist, its only a figment of deniers imagination.
You obviously need some adjusting. So repeat after me….’I accept that the UHI effect does not exist..I accept that the UHI effect does not exist’…. now quickly drink this green Kool-aid, there you go, drink it all up. That’s good, now don’t you feel better?
http://www.youtube.com/watch?v=8Sp-VFBbjpE
NOAA calculated in a 2010 study an increase of 0.8 F in the average temperature at the Luis Muñoz Marin Airport in San Juan PR with the addition of a new taxiway within 61 ft of the weather station. Previously the temperature sensor was >100 feet from nearest asphalt.
http://www.srh.noaa.gov/images/sju/climo/sr232.pdf
Back in August, 2009, NOAA at Boulder scientist Susan Soloman (YEAH, she of the IPCC AR4 leadership-she’s since retired), presented a talk on global Warming to some 400-500 citizens at the Denver Museum of Nature and Science. It was all IPCC boilerplate – except when she tried to make it personal and Rocky Mountain friendly. She did this by claiming that we ought to see the effect of AGW form ACO2 at higher altitudes first. Sure enough, mountain town after mountain town showed arming in recent decades. Except Boulder, which puzzled her. I later looked at the “Mountain towns,” and time after time they were all in the valleys developed by the ski and snowsport industry since 1960, experiencing exponential growth until recently. UHI/LUC, anybody? Of course.
Boulder’s temperature station, meanwhile, is at NCAR, on the West side of Table Mesa. Off the West side of the NCAR parking lot – ie, on a grassy are surrounded by Boulder’s forested mountain parks and the foothills. Thus, even a truly eminent scientist, when stepping outside her speciality, trying to do citizen education, is vulnerable to stepping into a pile of s***.
“The population of Fort Collins has quadrupled over the last 100 years. By contrast, Boulder’s population has been stable and shows cooling over the last 60 years.”
In the past 100 years, the population of Boulder, Colorado as increased from roughly 9,500 people to nearly 100,000 people. That’s your definition of a stable population? Even if you were referring to only the past 60 years, Boulder’s population has increased from about 20,000 to 100,000, a factor of 5.
Also, in what year was the bus station in Fort Collins built? If it has had a significant impact on the recorded temperature at Fort Collins, we should be able to see a sharp jump in the temperature graph that marks the year of its construction. Also worth asking: has the area around the Boulder temperature sensor undergone a similar transformation?
I can’t help you if you can’t read.
Clever….In a similar vein, I can’t read if you can’t write. My questions are valid. You can’t conduct what you call “Real Science” unless your information is correct in the first place. I believe you’ve made that argument once or twice yourself in the past.
Population growth has been much faster in Fort Collins than in Boulder. FC is blue. Boulder is red.
See? That wasn’t difficult. Now how about the other questions: what year was the Fort Collins bus station constructed, what was there before, and what (if any) similar changes have happened in the immediate vicinity of the Boulder site within the time frame in question? These all seem to be pertinent questions to your analysis. No sense doing a half-cocked job like NASA and NOAA.
Weren’t you saying the past 60 years? Your graph starts at 1970, which was only 40 years ago. Boulder’s population nearly doubled between 1950 and 1950, and grew at only a slightly slower pace between 1960 and 1970.
Calm down Travis. The FC station is right in the middle of town. The Boulder station is up against the foothills.