Einstein said that as a joke mocking junk scientists, but Hansen took him literally.
In 1999, Hansen was troubled by the fact that millions of temperature records showed that the US wasn’t warming. So in the year 2000, he simply changed the data to match his theory.
Hansen 1999: “in the U.S. there has been little temperature change in the past 50 years, the time of rapidly increasing greenhouse gases — in fact, there was a slight cooling throughout much of the country”
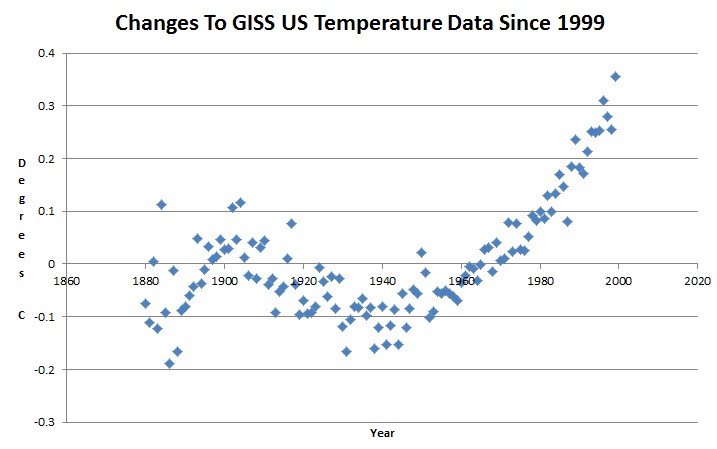
The graph below shows the difference between current published GISS US temperature data, and what they published in 1999.
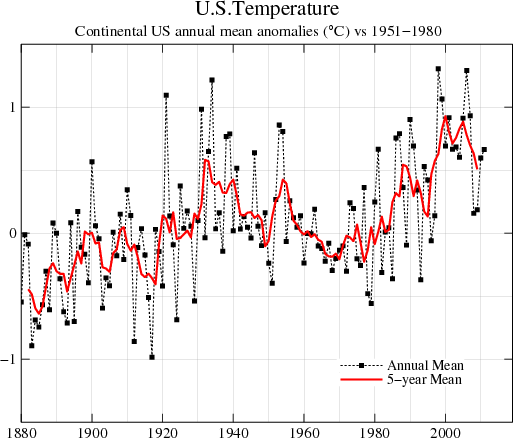
Current GISS US temperature data
1999 version of GISS US temperature data
The 1880s, 1930s and 1940s are now being reported by Hansen as nearly 0.2C below what the thermometers actually read, and current temperatures are being reported nearly 0.4C above what the thermometers read. Based on the data tampering curve above, we can infer that Hansen believes that modern thermometers are poor, and progressively getting worse.
After Hansen’s clever data tampering, the US now appears to be warming and his theory is validated in the minds of the press and politicians. The entire US warming curve below is due to the fact that the temperatures being reported by GISS are not what was measured by the thermometers. If the actual thermometer data was shown in the graph, there would be no warming.
They could make a video game out of this and call it Grand Theft NASA.


Don’t mistake environmentalist wackos for people interested in what the data really shows.
, Hansen , Mann , Jones , Schmit , etc etc aren’t interested in truth. They are good little peons grubbing away for their masters in the job of giving their masters reason to implement their thieving policies so that they can gain power and riches and control over those of us who feel it is honorable to work for a living.
Hansen and friends strongly warm bias the data to fit their agenda, then use the warm biased data to “prove” every month is the warmest month and every year is the warmest year. The slobbering MSM then laps it all up and unquestioningly reports it as fact with huge imagined dire consequences. Not a very sophisticated shell game.
Coul dyou clarify the graph of changes above – is this the differences applied or the result ?
It is the difference between the current published GISS data and what they published in 1999.
Now awaiting Deep Manure’s reply that you didn’t provide data.