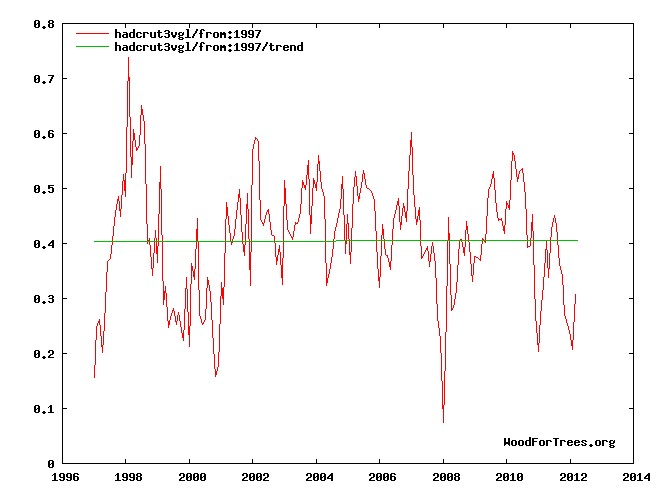
The US Senate unanimously rejected Kyot0 in 1997, and since then there has been no change in global temperature.
Wood for Trees: Interactive Graphs
The lesson from this might seem obvious, but the woman below is having a tough time figuring it out.
The German chancellor, Angela Merkel, warned on Monday that global warming will accelerate at a dramatic rate unless leaders reach a deal on limiting greenhouse gas emissions as soon as possible
The current rate of warming is 0.0 degrees per century. Imagine the disaster if that increased by a factor of ten. Our leaders tell us that we need to do much better than Kyoto, in order to slow down global warming even further.


I get a negative trend for 15 years:
http://www.woodfortrees.org/plot/hadcrut3vgl/last:180/mean:12/plot/hadcrut3vgl/last:180/trend
Although I don’t think the linear trend is robust because if you add 16 years, it goes positive again. No doubt due to the big El Nino of ’98.
If you start in 2001, it is a cooling trend.
I’ve made the observation before that the trend is not robust. Add or remove a year of data and the linear trend changes. That to me doesn’t suggest we are seeing much of a “CO2 signal”. Rather we are seeing a lot of natural variability. If the CO2 contribution to temperature is going to be significant, we’ve yet to see evidence of it.
Yes, we know that 1997-1998 warmed while recovering from the Mt Pinatubo eruption, and that there has been no warming since.
Yes but we’re all using HADCRUT4 now aren’t we? Well we are if we want to keep that positive trend going up and up….
Lies, damned lies, statistics, and climate science.
HADCRUT3gl data till 2012.25 (the latest available) shows that the trend since 2001 is now near -0.8°C (-1.44°F) per century. HADCRUT4 only covers till 2010.92.
NCDC – Monthly Global Surface Temperature Anomalies (16-May-2011, NOAA, National Climatic Data Center) is the latest available.
Is there a a climate data blackout?
Is Habibullo Abdussamatov correct and the Sun is causing all this cooling?
Is Henrik Svensmark correct about the mechanism?
Right now it would seem that only Roy Spencer and John Christy are showing their data.
HadCRUT3 global data is available up to May 2012 via the UKMO website, although not via the CRU website.
http://www.metoffice.gov.uk/hadobs/hadcrut3/diagnostics/global/nh+sh/monthly
Figures are usuually published earlier on the UKMO site and figures should be identical to those on the CRU site, once the latter has caught up!
As for Hadcrut4, that is not up to date since it ends in 2010. However there is a way around that. If we plot GISS from 1997.5 to 2012.5 and also from 1997.5 to 2011, the difference in slope is 0.003 lower for the total period. If we plot Hadcrut4 from 1997.5 to 2011, its slope is 0.007. So if we now subtract 0.003 from this, we get 0.004 which should be very close to what we should get if it were up to date. Now going back to Phil Jones comments, 0.012 was barely NOT significant over 15 years. So if that is the case, then 0.004 certainly is NOT significant either over 15 years, despite using the Hadcrut4 set. What I talked about is illustrated below.
http://www.woodfortrees.org/plot/hadcrut4gl/from:1997.5/plot/hadcrut4gl/from:1997.5/trend/plot/gistemp/from:1997.5/trend/plot/gistemp/from:1997.5/plot/gistemp/from:1997.5/to:2011/trend
It is amazing what Hansen can do by fabricating Arctic temperatures.