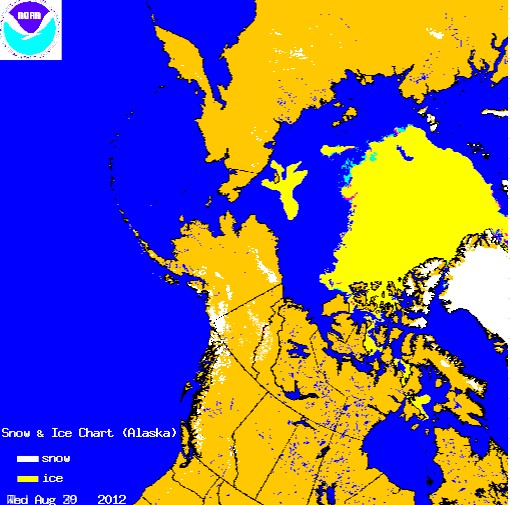
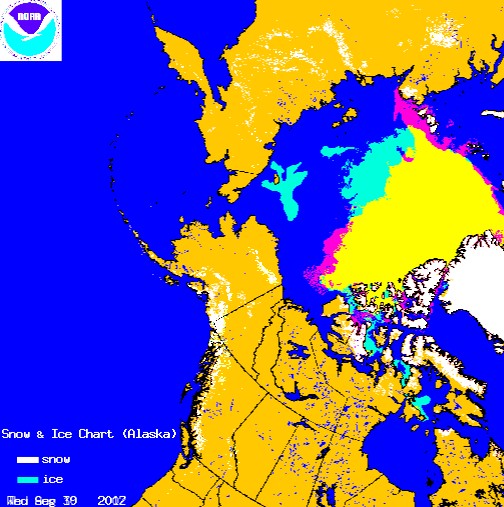
Green shows areas of ice gain since yesterday, red shows areas of ice loss.
Ice extent increased almost one percent since yesterday, indicating that this may be the shortest melt season on record.
There is 12 % more Arctic ice than at the 2007 minimum, and increasing. This does not include the Greenland Sea, which isn’t on the map and shouldn’t be counted. Greenland Sea ice is headed to a rapid doom.
http://www.natice.noaa.gov/pub/ims/ims_gif/DATA/cursnow_alaska.gif


If the trend continued it would be consistent with the claim that we are looking at weather events and not temperature changes.
Melt season keeps getting shorter. Soon there won’t even be one!
😉
Of course, this shortest melt season is CAUSED by Mann-Made Global Warming – human made CO2 is THE cause, of course!!!!
/sarc off
Shortest melt season on record? No, only on your self made map.
Nobody else has determined it has finished, even NIC
http://www.natice.noaa.gov/ims/images/sea_ice_only.jpg
Andy
Don’t be daft. Their maps shows an increase in ice extent since yesterday.
Steven loves his home-made graphs, especially if they are over very short time periods.
Are you also completely daft?
Yup it does look like the melt season has ended. DMI also showing an abrupt stop. If the extent rises rapidly it would be consistent with a longer term recovery which some scientists have been predicting. Interesting times.
Isn t it a little bit early to declare the end of melting?
most datasets seem to still show a decline:
http://www.ijis.iarc.uaf.edu/seaice/extent/plot.csv
a short melting season with an early and deep end (like potentially this year was) would not be a good thing either. (minimum/lows reached while there still is more sun…)
Nobody in the real world cares. Nothing really bad will happen. It’s called weather. Maybe you need to get away from the computer more. 😉
less ice does have an effect.
http://neven1.typepad.com/blog/2012/08/wasislac.html
You will have to read it, to understand it. It will be the longest piece you have ever read!
Since the scientists are correct about later and later end of melting, the canoeists should put their lives and money where the scientists mouths are, and start rowing in September.
Man up, people… take one for the team.
JAXA showed a decline of 35,469 square kilometers for 8/30. The JAXA figure is now 3,877,031 square kilometers. That is 377,500 square kilometers (8.9%) below the 2007 minimum.