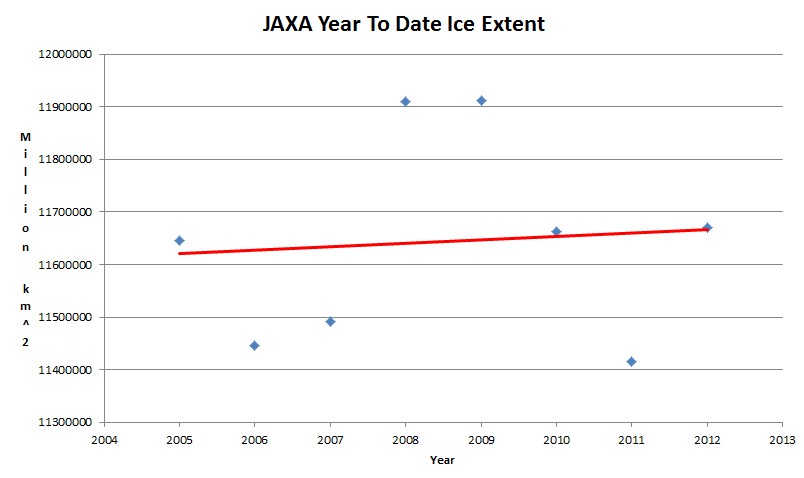
http://www.ijis.iarc.uaf.edu/seaice/extent/plot.csv
Alarmists don’t care about actual facts. They chose instead to cherry-pick inaccurate late summer data (at one pole only) when the sun is low in the sky and it has minimum effect on the SW radiative balance.


It is all angel dancing one way or another. There is very little transport of cold air from the high Arctic in summer and it’s the snowcovered landmass between 50 and 70 N that produces the Arctic outbreaks in winter.
you are starting from the last minimum.
this is another entry for “most misleading trend line ever”.
well done Steven!
The graph starts in 2005, you moron.
Odd that they only gag on cherries, when someone else picks for them.
Fine. If you didn t cherrypick a low, why not show us the full graph, to put this “recovery” into perspective?!?
Steven likes his home-made graphs.
What an incredibly stupid comment.
I provided a link to the data. Plot it yourself and let me know what I did wrong.
And others enjoy the veracity, traceability, accuracy and on the topic illumination that they give to the subject in question.
Unlike many put out by numerous government agencies.
stevengoddard says:
August 31, 2012 at 3:01 pm
What an incredibly stupid comment.
I provided a link to the data. Plot it yourself and let me know what I did wrong.
—————————————————————————————————————
Here’s a good bet to make: does Whatever know how to plot graphs?
“…to date..” What’s so special about August 31,Steve?
Are you being mental? How could I possibly know what sea ice extent will be next week?
Spam
Well tell us then, your holiness!
Or Spam. That works too! 😆
Whatever says:
August 31, 2012 at 2:59 pm
Steven likes his home-made graphs.
Right after…
gator69 says:
August 31, 2012 at 2:50 pm
Odd that they only gag on cherries, when someone else picks for them.
Too funny!!!
Try graphing the volume over the past 10 years there Stevie boy.
Even once the Arctic is ice-free some summer in the not too distant future, Steve will be claiming that there is more ice than 2007.
Denialism is a sad disease.
I’ve plotted PIOMAS dozens of times and posted it here. Stop being a complete idiot.
See Steve, they only like alarmist picked cherries. Polite guests would not make such a scene. 😉
Are you suggesting Steve was cherry-picking?
Of course he was…and they are psychotrophic cherries he picks that create a break with reality. Spit out your psychotrophic cherries and sober up to reality.
Here’s the reality: The Arctic sea-ice is declining, we will have an ice-free summer Arctic much sooner than anyone thought possible just a few years ago, and human greenhouse gas emissions are to blame.
Oh, but your cherries are special!
Whatever psycho.
😆
R. Gates,
“we will have an ice-free summer Arctic >>> much sooner than anyone thought possible <<< just a few years ago".
Your statement is fantasy, not reality.
You don't retain much of what you read, do you? Go re-research ice-free arctic predictions, you will see many have been made, and falsified. So multiple geniuses thought it possible before today.
R. Gates
I think you don’t even understand how cheap your shots are.
R. Gates
Are you intentionally trying to be so idiotic as some kind of psychology project or somehting?
The new Ice Age is coming. I expect a double fast recovery of the Arctic ice this winter. I wonder how the warmists are going to spin that.
the decreasing trend is less pronounced in winter than in summer, so logically recovery might be faster than ever this year. And on your first point: there’s a (warmist) theory that higher CO2 levels will prevent the kick-off of a new glacial period.
(with “ever”, I mean the last 30 years, obviously)
Here is yet another older study by John Walsh and Claudia Johnson of Arctic sea ice which states that satellite data was kept from at least 1966, and includes a nice graph (figure 5b) on p. 585 that shows a particularly low sea ice extent in 1961: bit.ly/O1vhQh
Michael, Thank you sir!
Julienne, can you review Graph “b” on page 585 and explain what happened to cause the 1961 anomaly to disappear from your records?
Steven,
Would you consider bumping Michael’s post? It’s as beautiful as the historical ice charts recently re-discovered.
Meanwhile, down in the australis [where’s our MMGHG-CO2?], sea ice is doin fine. Antarctic peninsula and Weddel sea doin’ fine and Emperors luv it and had lots of kids, summer of cool is coming and everything balances out.
http://emperor-penguins.com/index.html
Nobody wants to know, cooling is not ‘hot’ news.