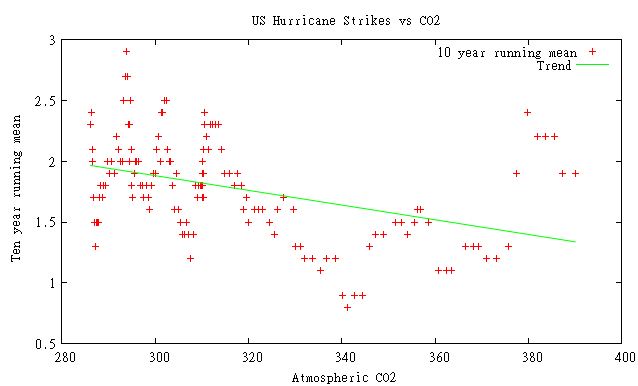
Hurricane strikes were more common when CO2 was less than 320 ppm.
The graph above plots the ten year running mean of US hurricane strikes vs. atmospheric CO2. As you can see, there is no correlation between increasing CO2 and increasing hurricane strikes.
Here is the data :
286.2	2.3
286.4	2.4
286.5	2.1
286.6	2
286.8	1.7
286.9	1.7
287	1.5
287.1	1.5
287.2	1.3
287.4	1.5
287.5	1.5
287.7	1.5
287.9	1.5
288.1	1.7
288.4	1.8
288.7	1.7
289	1.8
289.4	1.8
289.8	2
290.2	1.9
290.7	2
291.2	1.9
291.7	2.2
292.1	2.1
292.6	2
293	2
293.3	2.5
293.6	2.7
293.8	2.9
294	2.7
294.2	2.3
294.3	2.3
294.5	2
294.6	2.3
294.7	2.5
294.8	2.5
294.9	2.1
295	1.8
295.2	1.7
295.5	1.9
295.8	2
296.1	2
296.5	2
296.8	1.8
297.2	1.8
297.6	1.7
298.1	1.8
298.5	1.7
298.9	1.6
299.3	1.8
299.7	1.9
300.1	1.9
300.4	2.1
300.8	2.2
301.1	2
301.4	2.4
301.7	2.4
302.1	2.5
302.4	2.5
302.7	2.1
303	2
303.4	2
303.8	1.8
304.1	1.6
304.5	1.9
305	1.6
305.4	1.5
305.8	1.4
306.3	1.4
306.8	1.5
307.2	1.4
307.7	1.2
308.2	1.4
308.6	1.8
309	1.7
309.4	1.8
309.8	1.8
310	1.8
310.2	1.8
310.3	1.7
310.4	1.9
310.4	2.1
310.3	2.1
310.2	1.7
310.1	1.8
310.1	1.9
310.1	1.7
310.2	2
310.3	2.1
310.5	2.3
310.7	2.4
311.1	2.2
311.5	2.1
311.9	2.3
312.4	2.3
313	2.3
313.6	2.3
314.2	2.1
314.9	1.9
315.98	1.9
316.91	1.8
317.64	1.9
318.45	1.8
318.99	1.6
319.62	1.7
320.04	1.5
321.38	1.6
322.16	1.6
323.04	1.6
324.62	1.5
325.68	1.4
326.32	1.6
327.45	1.7
329.68	1.6
330.17	1.3
331.08	1.3
332.05	1.2
333.78	1.2
335.41	1.1
336.78	1.2
338.68	1.2
340.11	0.9
341.22	0.8
342.84	0.9
344.41	0.9
345.87	1.3
347.19	1.4
348.98	1.4
351.45	1.5
352.9	1.5
354.16	1.4
355.48	1.5
356.27	1.6
356.95	1.6
358.64	1.5
360.62	1.1
362.36	1.1
363.47	1.1
366.5	1.3
368.14	1.3
369.4	1.3
371.07	1.2
373.17	1.2
375.78	1.3
377.52	1.9
379.76	2.4
381.85	2.2
383.71	2.2
385.57	2.2
387.35	1.9
390	1.9


Steve, Dr Roy Spencer has the October numbers. + 0.42
http://www.drroyspencer.com/2010/11/oct-2010-uah-global-temperature-update-0-42-deg-c/
Cool, thanks.
Gee! No pretty Bar graph! 🙁 😉
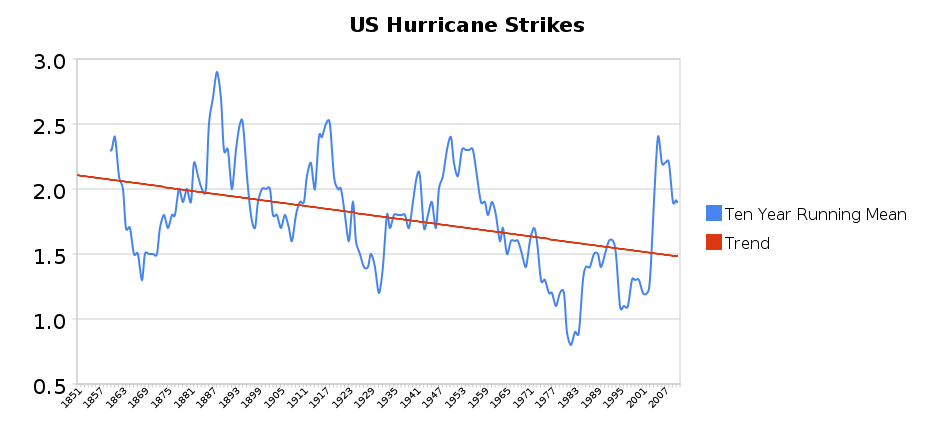
I added a trend graph at the top
I did not want or need one but I was trying to divert complaints. If you provide a graph the complaint is no numbers. If you provide numbers the complaint is no graph. We have been through the number of data points and Cherry Picking. I will await the next complaint from the Peanut Gallery!
Interesting and fun to see this stuff again and “Calmly” “Discuss” climate and weather issues. Maybe Brother Joseph will stop over and bless us with his presence! I have not talked to the GAV since he stopped letting me post at surrealclimate but I have seen he wanders about from time to time so maybe he will visit “The Little People”. or was that the Unwashed!
By the way I am glad to see you have your site.
Rumor has it that I am really a nice guy! When I am asleep! 😉
You can see there was more severeweather before the Little Ice Age ended around 1900.
Sallie Ballunis, Astrophysicist at the Harvard Smithsonian Center for Astrophysics, talks about a period of time during the Little Ice Age when severe weather was off the charts:
http://www.youtube.com/watch?v=8C1CKKhN7ng
AAM:
Having satellite I do not do much youtube because of limitations on megabytes per day. Is there a link to a transcript of that talk. I have read a bit of her stuff so maybe I have already read that!
Mike Davis
This is the link to transcript at the conference Sallie Baliunas spoke at:
http://www.independent.org/events/transcript.asp?eventID=111#4
“Hurricane strikes were more common when CO2 was less than 320 ppm.”
Why?
Andy
Why ask why?
Because I wanted to know what the point of the statements was, ie why would amount of CO2 change track paths of hurricanes in the Atlantic.
I thought CO2 was just linked to intensity, not direction???
Andy
You do realise that you are talking solely about hurricane strikes on the US, not hurricanes? Which seems a bit like you think the global climate revolves around you.
For some actual research on hurricanes;
“According to the 2007 Fourth Assessment Report of the Intergovernmental Panel on Climate Change (IPCC-AR4), globally “[t]here is no clear trend in the annual numbers [i.e. frequency] of tropical cyclones.” ”
They are not whining, so it must be you.
“However, in the North Atlantic there has been a clear increase in the frequency of tropical storms and major hurricanes. From 1850-1990, the long-term average number of tropical storms was about 10, including about 5 hurricanes. For the period of 1998-2007, the average is about 15 tropical storms per year, including about 8 hurricanes. This increase in frequency correlates strongly with the rise in North Atlantic sea surface temperature, and recent peer-reviewed scientific studies link this temperature increase to global warming. ”
http://www.pewclimate.org/hurricanes.cfm#freq
it was remarkably inviting to look over stevengoddard.wordpress.com
I call for to reproduce your fill someone in on in my blog. It can?
And you et an account on Twitter?