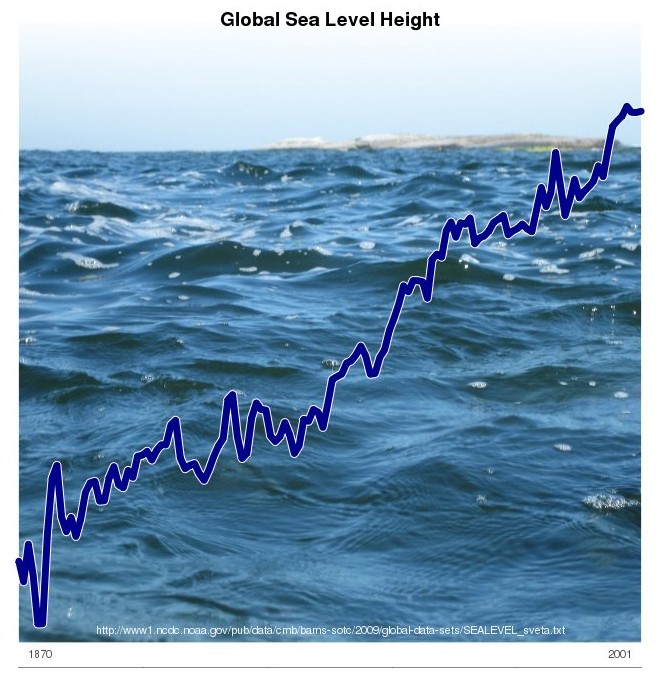
Real Climate published this sea level plot – to prove global warming.
RealClimate: The answer is blowing in the wind: The warming went into the deep end
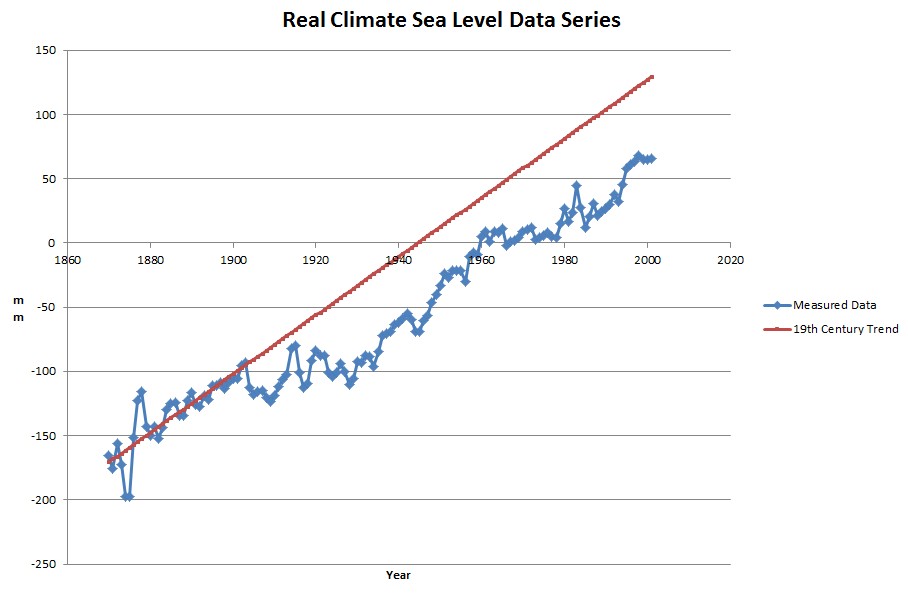
So I went to their data source, and plotted the 19th century trend on top of the data set. As you can see, sea level rise has slowed considerably since the 19th century.
www1.ncdc.noaa.gov/pub/data/cmb/bams-sotc/2009/global-data-sets/SEALEVEL_sveta.txt
During the 19th century, sea level rose at 2.3 mm/year. The post 1900 trend is 1.9 mm/year.
Real Climate has boldly proven that sea level rise has slowed by almost 20% since the 19th century.
h/t to Gavin


Those numbers are adjusted with model-derived GIA figures, which inflate the rate. The reality is that most coastal tide stations have measured less than 1.5 mm/year of sea-level rise, and there’s been no acceleration (increase) in the rate of rise in over 80 years.
See http://www.sealevel.info/ (click on “data” and scroll to the bottom to see mean and median values)
So the SUV is saving us from a watery grave? Thanks Gavin.
I wonder how they could be so blatantly foolish, unless they (and are we talking Gavin Schmidt here, in which case I believe he is that foolish, in his deluded acceptance of the consensus and the sacred “peer-reviewed literature”) just liked that graph so much they couldn’t resist it (it is pretty — but it is also pretty clear, as you say). As a real scientist, however, I would pedantically point out that that pre-1900 data is suspiciously lacking in random variations (noise) around the trend, while after 1900 they seem to have forgotten how to measure as well as before, with variational excursions of, say, 25 mm over a period of, say, 2 decades (and also from one year to the next, sometimes). Then of course, there is that 1900-1935 period, when the ocean refused to rise, and afterwards resumed its old rate of rise, only at a level 50 mm lower than before. As an independent scientific auditor–which I am not (officially) but somebody like me should be–I once again demand to know of them, “who’s in charge here!?” And Dr. Schmidt, you’re fired, this organization cannot be further embarrassed by you. Next. (No doubt about it, I’m power hungry, I am, at times. Delusions of vast influence…hmm… Mr. Obama–you’re fired too. You idiot.)
Schmidt disappoints. – gavin
“h/t to Gavin – Priceless
Millimeters?
The Y-axis is displayed in ƒü¶••in’ millimeters?
Since the sea level change since the last glaciation is measured in hundreds of meters???
Since we are trying to establish whether or not man has an influence on climate, ergo sea levels, which is the crux of the matter, let’s put the scale in true context, please. Can someone plot the recent sea change with the ordinate (Y-axis) at least ±500 meters? Then we can have a true perspective on man’s influence..
A flat graph is not frightening enough! 😉
I find it interesting they knew within one mm what the Global msl was in the 1800s and 1900s. Those must have been some really fine satellites taking the measurements.
Most likely it is based on Extrapolation, “read WAG”!
Oh no!
Hold the presses!
“Sea rises slightly after glaciation ends.”
We really should thank Schmidthead, and the rest of the alarmists, for disproving the AGW hypothesis in a most thorough and exhaustive fashion.
Ok, I see.
Gavin is not a fool. He is a man of average intelligence secretly assuming he is a genius.