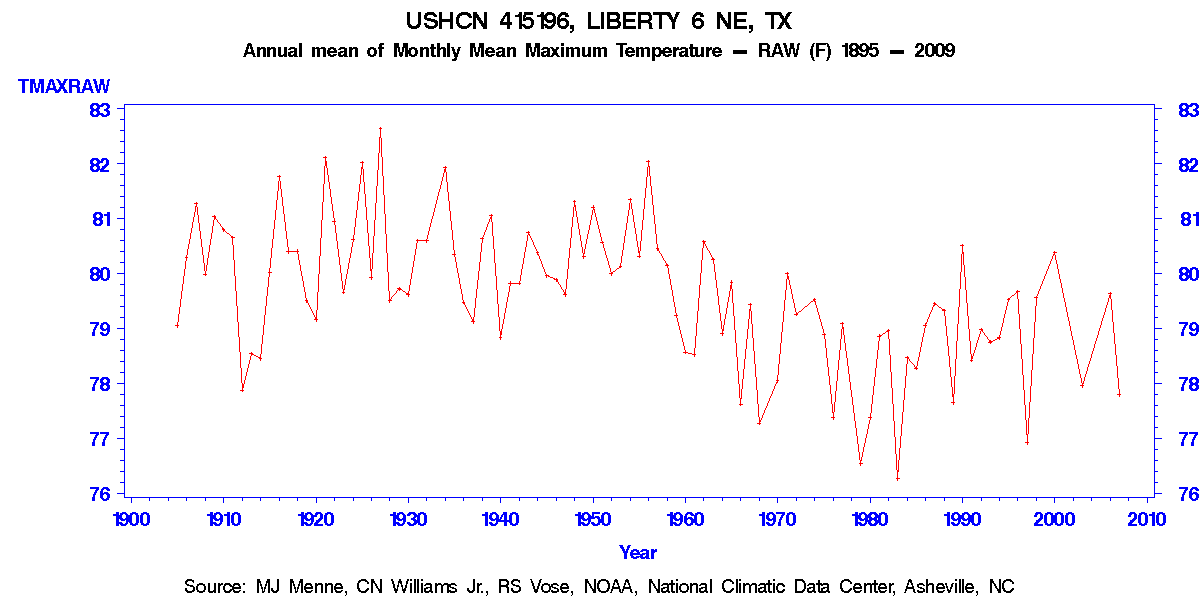
The raw data shows a strong cooling trend for maximum temperatures in Liberty, Texas.
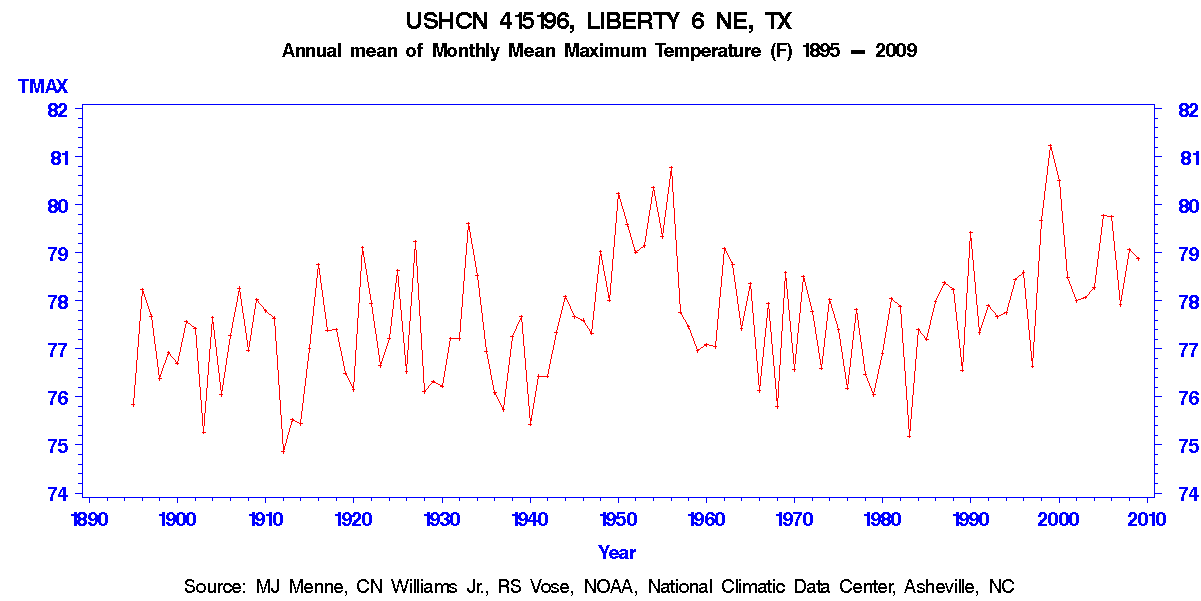
Through the magic of USHCN adjustments, this cooling trend gets turned into a warming trend.
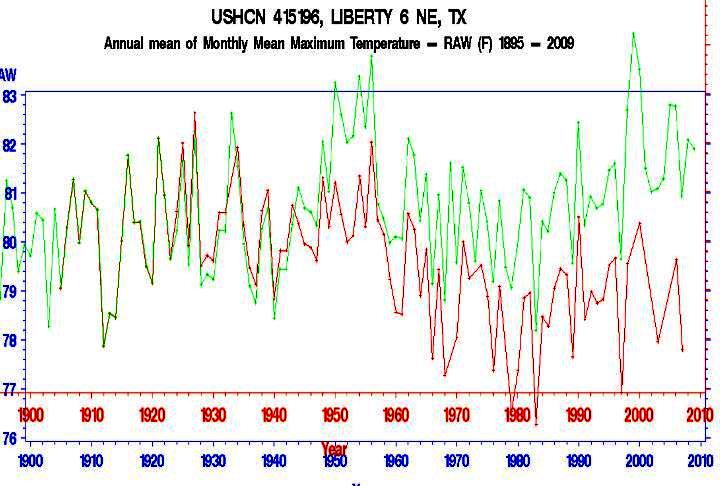
The graph below shows the adjusted data overlaid, and normalised to 1910. Note that they have added an impressive four degrees to the trend!
I find this nothing short of incredible.


Global warming is continued through honesty and all good conscience.
sarc of
Funny how our warmist friends always stay clear of these type of posts.
Paul H, I always think the same thing, outside of ‘cherry picking’ and ‘you didn’t read and fully understand the reason for the adjustments’ you didn’t hear much at all. Now, I think they gave up on the posts with hard REAL data.
Liberty, Texas is the third oldest town in Texas…. with a growing population… 2000: 70,154… 2009: 74,911… and a growing Urban Heat Island effect… so USHCN is not so much taking a liberty with the data… its more like taking the piss…
http://www.surfacestations.org/USHCN_stationlist.htm gives Liberty a poor CERN Rating of 4 i.e error of ? 2?C
Hansen feels a sense of bravado too, I guess…
I suppose that this is considered real science too. You have a hypothesis, use falsified figures to justify your preconceived desired outcome and woolah!!!!! No problem here, this is science. Yeah, right. AGW science.
after climate gate and the smoking gun at darwin zero, it was post after post of this type that opened my eyes to scale of fraud behind the CAGW scare.
someday when i have time i will scour the web for all these graphs and put them in one place.
Makes NIWA’s paltry 1C effort seem like chickenfeed. The courtroom beckons…
http://www.climatescienceinternational.org/index.php?option=com_content&view=article&id=335
Keep up the good work Steve. 🙂