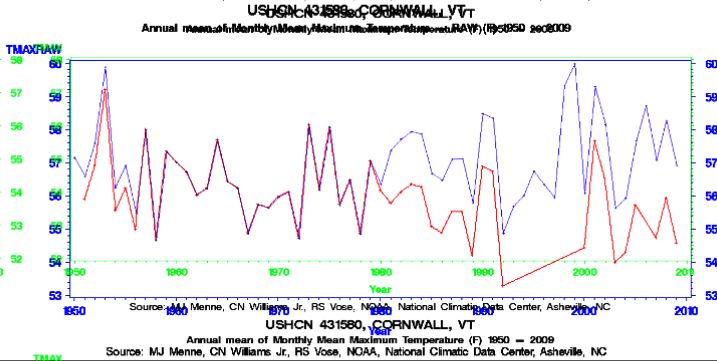
The graph above shows Cornwall, Vermont maximum temperatures raw (red) vs adjusted (blue.)
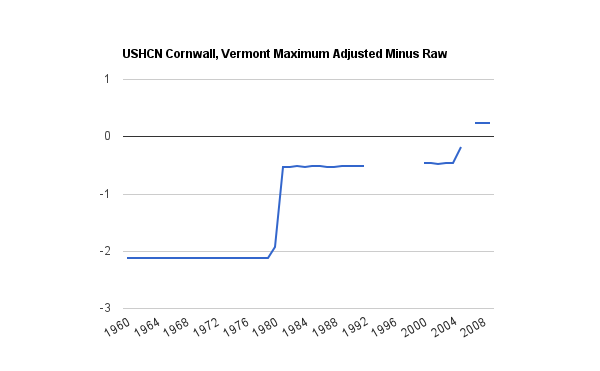
USHCN adjustments turned a measured decline in temperatures into an upwards trend. They did this by cooling the past two degrees and by increasing the present.


Lazarus always asks for evidence and proof.
I am sure he has already contacted the NCDC to ask for a full explanation of the adjustments.
We should get the answer soon.
This case looks better than others where there are yearly adjustments over a period of time. In this case, there were station location changes in 1950, 1956, and 1980.
431580 03 01 1928 11 25 1950 000000000000000 43 58 073 12 000 000 504
431580 12 01 1950 08 20 1956 000000000000000 43 58 073 12 001 NE 500
431580 08 21 1956 09 27 1976 000010000000000 43 57 073 13 014 S 340
431580 09 28 1976 11 16 1980 000000000000000 43 57 073 13 800 000 340
431580 11 17 1980 10 22 1985 000010000000000 43 57 073 13 014 N 490
The last column is elevation, the two previous values encode distance/direction from previous location (the 800 000 is a special case)
ftp://ftp.ncdc.noaa.gov/pub/data/ushcn/station.history.Z
Those stations just keep moving to colder locations. All over the country.
That could be one line of erasoning. As towns build up and UHI increases, the stations are moved to areas with a more “pure” (?) temperature signal. Of course, it was not thought through properly, a better way would be to put a new temperature station in the new location running concurrently with the old. Unfortunately, we’re now left with an untrustworthy temperature record, at least with the current algorithms being applied to it.
Anyways, I’m just saying that sometimes there may be actual reasons for adjustments. In this case, there’s at least a correlation between station movement and adjustment for the major change in 1980. At the same time, there’s no justification in the metadata for an adjustment after 2004.