
This year “will without a doubt” rank in the top five lowest levels of ice extent ever recorded in the satellite era, and there is a good possibility that 2013 could rank second in terms of recorded ice lows, said Walt Meier, a scientist at the National Snow & Ice Data Center.
“It’s kind of remarkable that it’s as low as it is [this year], given that the weather conditions were not terribly optimal for ice loss,” Meier said.
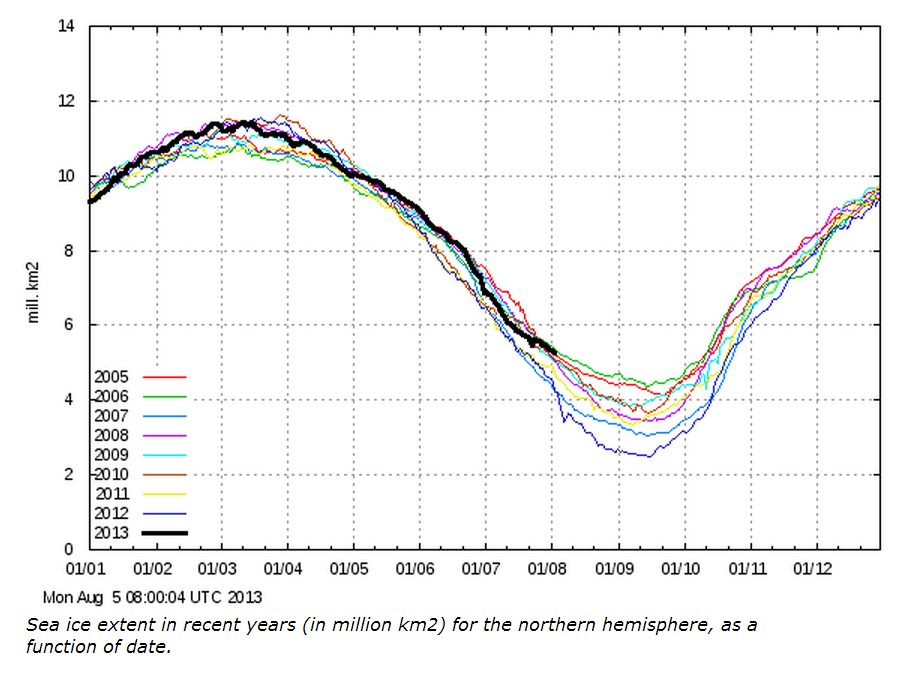
http://www.eenews.net/climatewire/2013/08/05/stories/1059985599
Earth to Walt. Arctic ice extent is the highest in the last nine years. What is remarkable is how the thin rotten decayed ice made such a spectacular rebound this summer.
COI | Centre for Ocean and Ice | Danmarks Meteorologiske Institut
[youtube=http://www.youtube.com/watch?v=L-g_Y0UCxmg]
h/t to Marc Morano

The Stupid is very strong in that one, very strong indeed.
“Without a doubt” means to me at least a 4-sigma confidence, and probably either a 5- or 6-sigma confidence. Given that it’s still quite possible to not end up in the lowest 5, he could eat major crow (see below). I was going to give him the benefit of the doubt and think that this quote was from last month, but given that the article is dated today, maybe I won’t. Additionally, the whole “weather conditions were not terribly optimal for ice loss” quote is very loose. Back in June, when the NP area was being hammered with cyclonic winds and the “hole” appeared, they said it was the end. In reality, we’ll probably end up with a 2009/2010-ish extent with more volume/mass than 2010 and the bulk of the ice farther west than we’ve typically seen this century, thus less likely to lose it over the winter, and essentially reversing 3 years of “death spiral” in a single season. As for where the minimum this year will end up, this is how I see it (based on an average of metrics):
Extremely unlikely to be below: 2013
Highly unlikely to be below: 2007
Unlikely to be below: 2008 & 2010
Slightly likely to be below: 2009
Likely to be below: 2005 & 2006
Extremely likely to be below: any year before 2006
I’d say the odds of ending up above the 4th lowest in the satellite era are a bit above 50%. Odds of being above the 5th lowest are probably below 50%, but still well above 10%, maybe 40%. Certainly not 4+ sigma probability. I need to pull out my numbers spreadsheet and put some actual predictions/uncertainties down. The thing is, I don’t see how he can claim “without a doubt” when ice area for today (according to CT) is higher than the last 5 years for August 4, the most recent data point. He must be assuming a lot of loss from here on out.
Also, he said in the article that we’d have to wait for September to see the minimum. A decently reasonable comment, but everyone throws out the possibility of an August minimum. 2005’s area minimum was actually Sept 1 and 1992’s was on Sept 2, so an August minimum isn’t out of the realm of possibility theoretically. And I’d say it’s more likely than the October minimum that some CAGWers have forecasted will become common due to CAGW. Though I should point out that 1995 actually had an Oct 1 area minimum. Only 1 other year came after Sept 22, which was 1997’s Sept 24.
All that said, Kudos to Dr. Meier for throwing out a prediction that can be tested within 2 months rather than 2 generations.
-Scott
This baloney has a first name, W-A-L-T-ER
This baloney has a second name, it’s M-E-I-E-R
Oh he loves to scare us every day
And if you ask me I would say
Walter Meier has a way with B-A-L-O-N-G-A!
Without a doubt some Arctic ice has melted this year. I think I am accurate to 99 beta, gamma, or sigma level
For alarmists, lack of melt can only be explained by lying superexponentially. No usual, garden variety lie will suffice under these circumstances.
I posted this at Neven’s blog. Will I be banned?
http://neven1.typepad.com/blog/2013/08/arctic-ice-loss-and-armchair-scientists.html
The well known anti-science saboteurs at DMI seem to think the sun has quite a bit to do with Arctic climate and ice. Of course IPCC AR4 dismissed the sun and ignored published research attributing solar effects when L&F put the “final nail” into the solar coffin to satisfy their political masters. Since 2007, there have been dozens of peer reviewed papers concerning solar influence on climate, completely debunking L&F (it didn’t take much to do that).
Multi-decadal variation of the East Greenland Sea-Ice Extent: AD 1500-2000
http://www.dmi.dk/dmi/sr05-02.pdf
Are you going to ban me Neven?
Peter Sinclair doesn’t think much of Steve’s use of IPCC 1990 Arctic ice extent data. I wonder how long my post will last there:
http://climatecrocks.com/2013/07/14/guest-post-its-ice-melt-season-deniers-let-the-conspiracy-theories-flow/comment-page-2/#comment-25510
You are not being completely forthcoming here.
For the chart where you say:
“This graph you can directly compare with the one used in the IPCC report as it uses SSMR data and displays it in a similar way. When you compare them you’ll notice that what happened in the 70s is nothing to the amount of ice that was lost during the past few decades.”
Below the chart it makes no mention of IPCC 1990 data, and states specifically data after 1979 was obtained through SMMR / SSM/I satellite data. Prior to 1979 it states:
“For January 1953 through December 1979, data have been obtained from the UK Hadley Centre and are based on operational ice charts and other sources. ”
Where can one obtain these operational ice charts and mysterious unnamed other sources? The chart in no way resembles the IPCC 1990 data. Basically, pre-1979 satellite data was ignored and “other sources” were grafted on to the NSIDC chart.
You left out part of the IPCC 1990 statement you quoted:
“Since about 1976 the areal extent of sea-ice in the Northern
Hemisphere has varied about a constant climatological
level but in 1972-1975 sea-ice extent was significantly less.”
You then go on to say:
“Why this is important is that this data is not directly comparable with satellites carrying Scanning Multichannel Microwave Radiometer (SMMR) instrumentation.”
If that’s true, how then can pre-1979 data grafted on to the NSIDC chart be directly comparable?
Also, since the claim is the last 30 years are outside natural variation, you need to explain the extensive melting and temperature increases in the 1920?s-1940?s, and the fact the vast amount of glacier melt occurred prior to 1960.
They had a different kind of ice in 1990. It wasn’t rotten and decayed in those days.