The CRU temperature record run by Phil Jones is fraudulent. The case for this is shown clearly below.
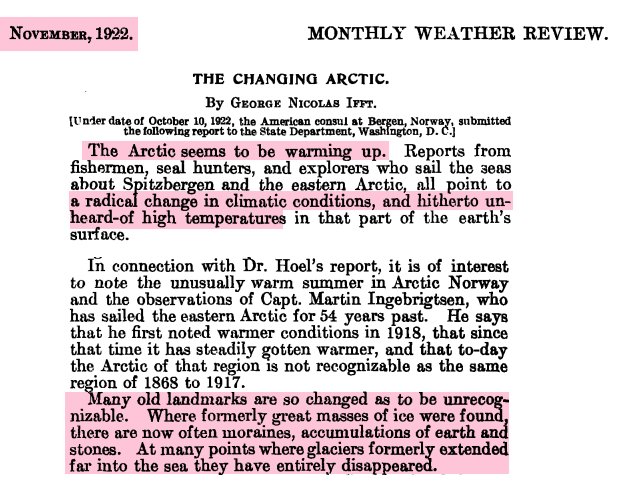
In 1922, the US Consul reported a “radical change of climatic conditions in the Arctic” with “unheard of high temperatures.” “Many old landmarks are so changed as to be unrecognizable.” “Glaciers have … entirely disappeared”
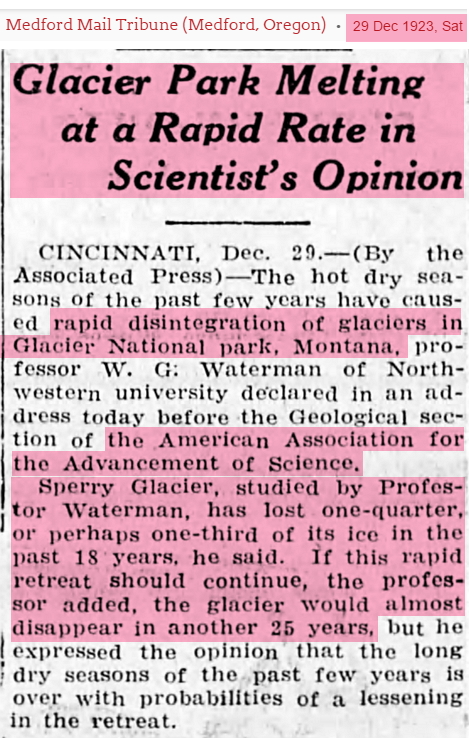
In 1923, the glaciers of Glacier National Park in Montana were rapidly disappearing and predicted to be gone by 1950.
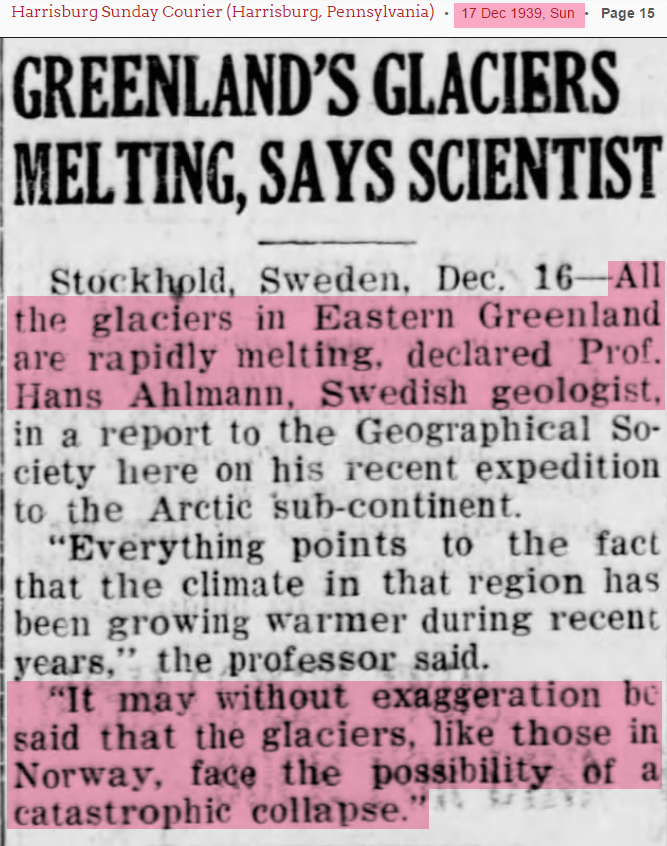
By 1939, all of the glaciers in Eastern Greenland were nearing “catastrophic collapse.”
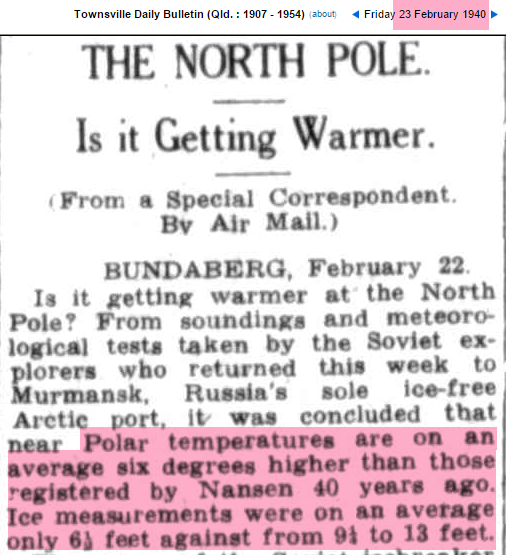
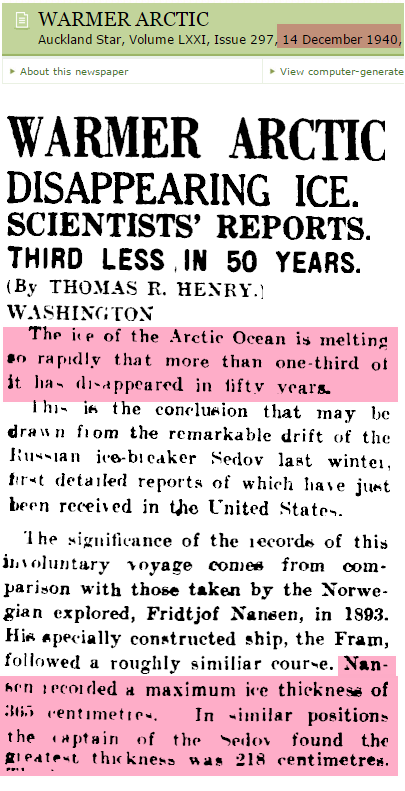
By 1940, the Arctic had warmed six degrees, and sea ice had dramatically declined in thickness.
23 Feb 1940 – Townsville Daily Bulletin – p7
Papers Past — Auckland Star — 14 December 1940 — WARMER ARCTIC
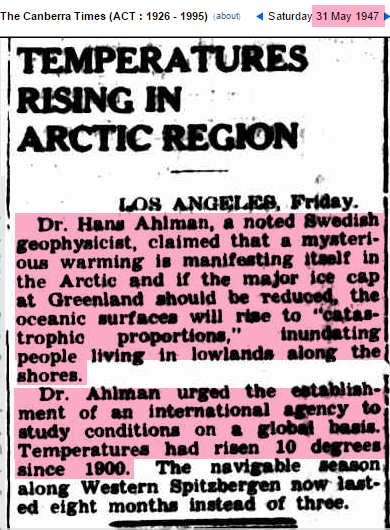
By 1947, a ten degree rise in Arctic temperature was reported, and scientists were worried about sea level rise drowning seaports.
31 May 1947 – TEMPERATURES RISING IN ARCTIC REGION LOS ANGELES…
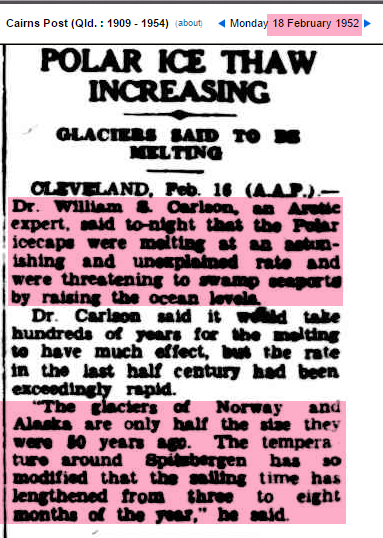
By 1952, the glaciers of both Norway and Alaska had lost half their mass. This tells us that the warming was universal across the Arctic.
18 Feb 1952 – POLAR ICE THAW INCREASING GLACIERS SAID TO [?] M…
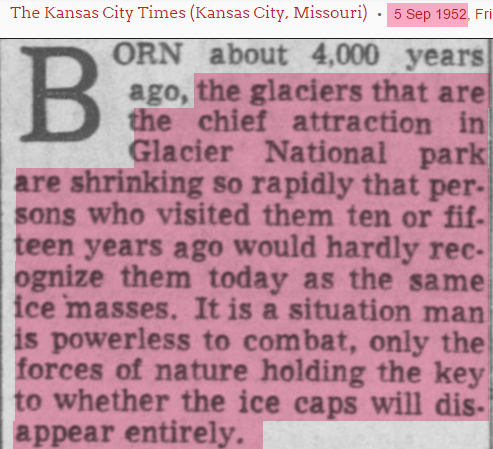
The glaciers of Glacier National Park in Montana were still rapidly disappearing.
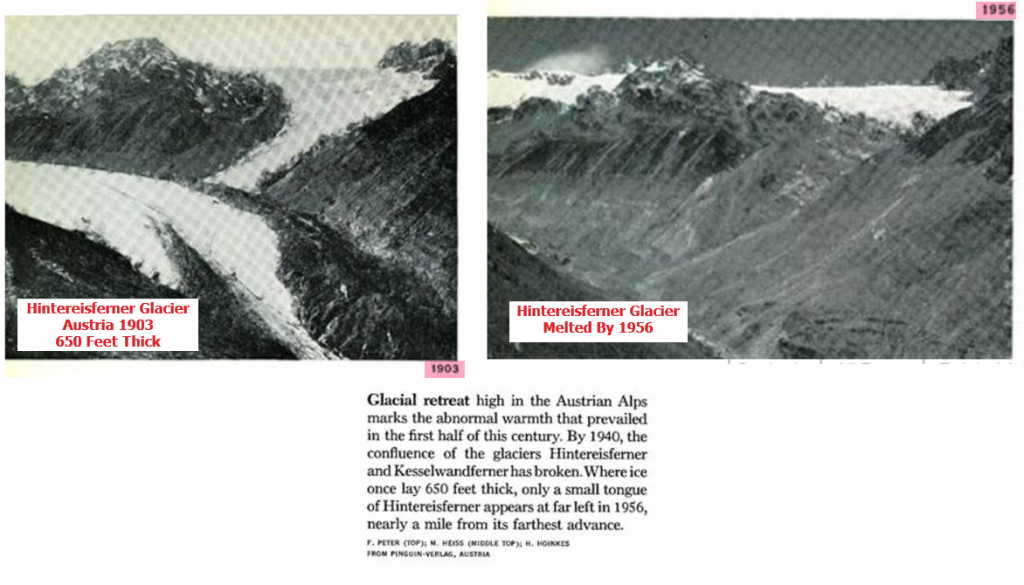
Glaciers in the Alps disappeared during the first half of the century.
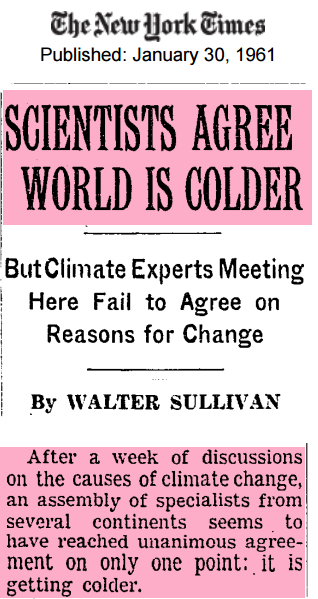
However, a dramatic turnaround occurred, and by 1961 there was unanimous consensus for global cooling.
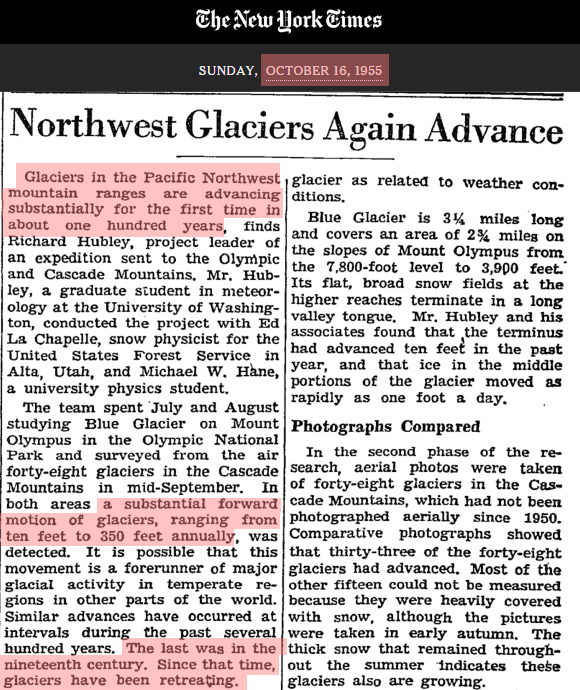
By 1955, the glaciers of the Pacific Northwest were advancing – “for the first time in about one hundred years.”
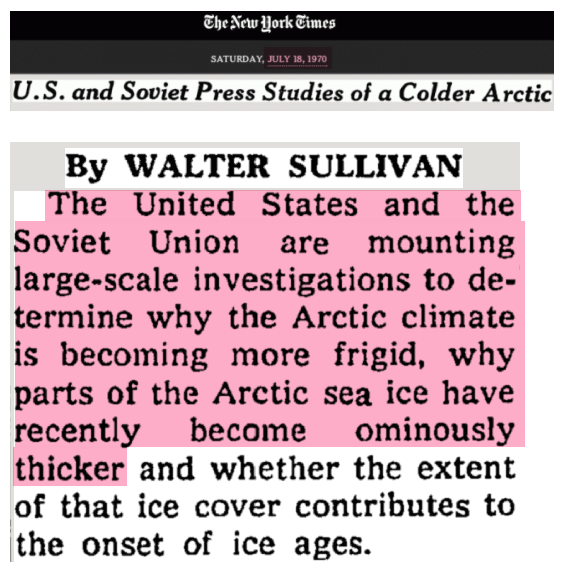
By 1970, the US and Soviet Union were trying to figure out why the Arctic ice was becoming “frigid” and Arctic sea ice was becoming “ominously thicker.”
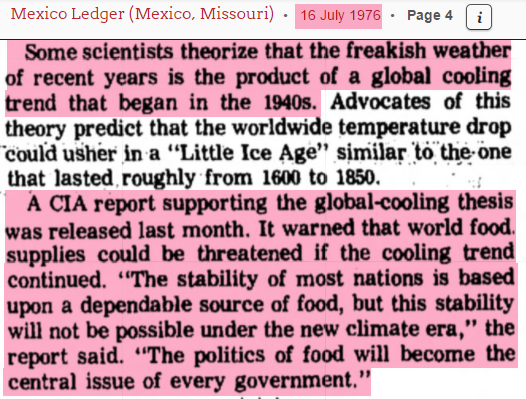
In 1976, scientists blamed “freakish weather” on global cooling, and the CIA said global cooling “will become the central issue of every government.”
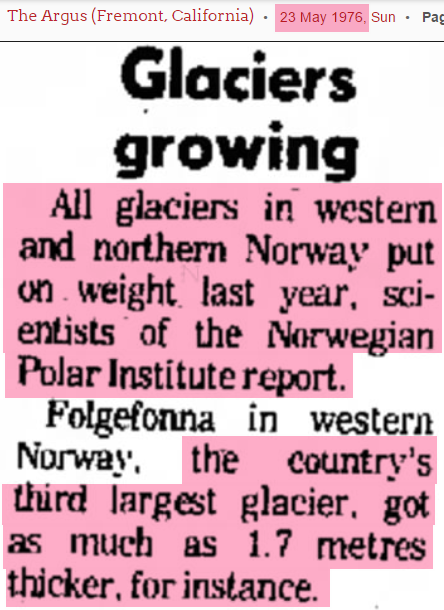
In 1976, all of the glaciers in northern Norway were expanding. The climate had cooled dramatically.
In 1979, the global cooling since WWII was “indisputable.” NOAA reported 0.5C global cooling”
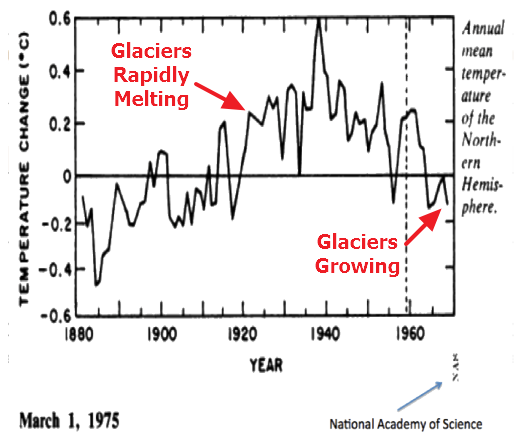
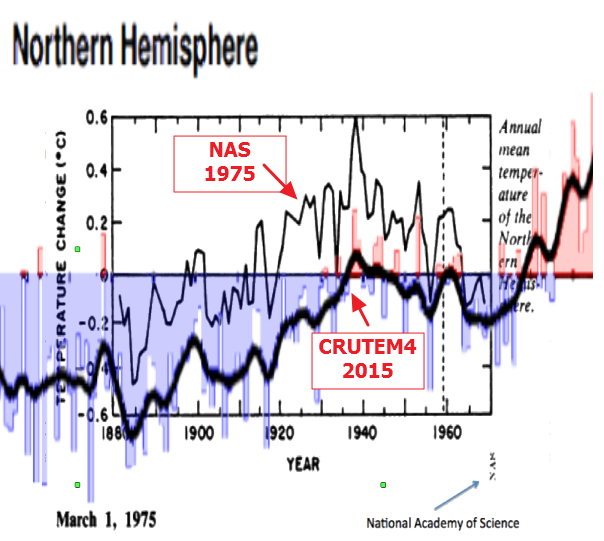
In 1975, the National Academy of Sciences generated a graph of Northern Hemisphere land surface temperatures which accurately showed the warmth before 1940, followed by half a degree cooling. This graph made sense based on the behavior of the ice across the Northern Hemisphere and Arctic.
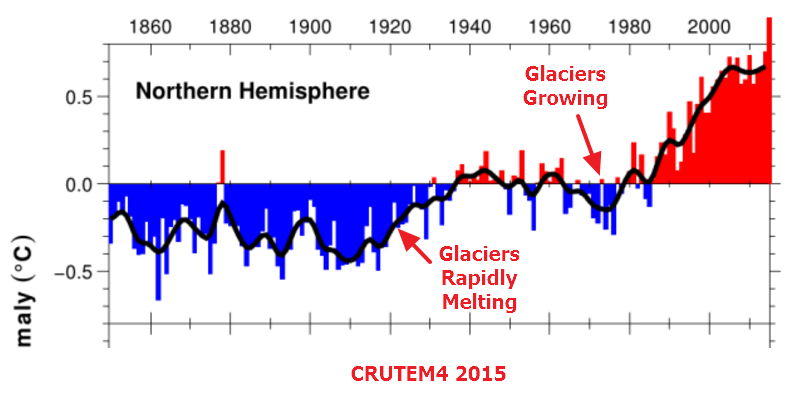
Here is where the problem comes in. The current CRU graph for Northern Hemisphere land surfaces makes no sense. It shows glaciers melting rapidly during a very cold period, and glaciers growing during a warmer period. The sharp cooling after 1940 has been nearly erased.
The CRU temperatures are nonsense.
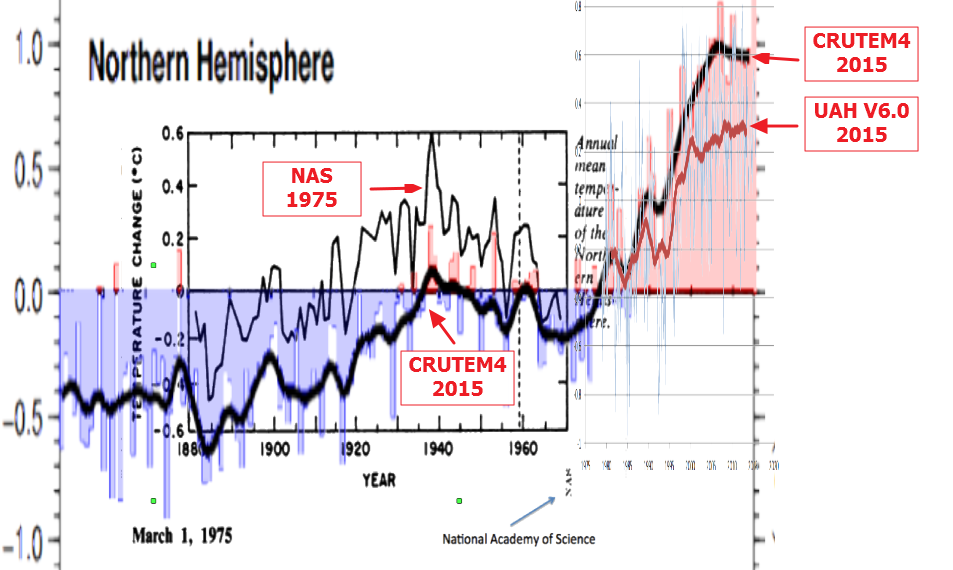
The next graph shows how CRU generated their fraudulent graph. They cooled pre-1960 temperatures by about half a degree.
The CRU fraud is much worse than that, however. Not only did they dramatically cool pre-1960 temperatures, but they dramatically warmed post-1980 temperatures relative to satellite Northern Hemisphere land temperatures (UAH V6) – to create a completely fake hockey stick of warming.
The 1975 National Academy of Sciences data, combined with the recent satellite data, shows us that there has been little net warming since the 1930’s. The hockey stick is a total fabrication by government scientists. Climategate E-mails confirm that this manipulation of data was the scientists’ intent, and that they intended to cover up their activities..
From: Tom Wigley <[email protected]>
To: Phil Jones <[email protected]>
Subject: 1940s
Date: Sun, 27 Sep 2009 23:25:38 -0600
Cc: Ben Santer <[email protected]>It would be good to remove at least part of the 1940s blip, but we are still left with “why the blip”.
Mike,
Can you delete any emails you may have had with Keith re AR4? Keith will do likewise… Can you also email Gene [Wahl] and get him to do the same? I don’t have his new email address. We will be getting Caspar [Ammann] to do likewise.
Cheers, Phil
Evidence is overwhelming that global warming/climate change is the biggest fraud in history.

