Eight years ago, the press announced that Asheville was ready for the next big rainfall event like the one during July 1916.
“Never before had so much rain fallen anywhere in the United States in a 24-hour period, the National Weather Bureau reported.
The French Broad River, usually about 380 feet wide, stretched 1,300 feet across. It crested at 21 feet, some 17 feet above flood stage. Though the rain had stopped on the Sunday morning of July 16, 1916, people were taken by surprise by the speed and volume of rising floodwaters.”

100 years after the Flood of 1916, the City of Asheville is ready for the next one – The City of Asheville
“In 1916, weathermen couldn’t predict a hurricane’s path with much more precision than the Farmer’s Almanac could predict the hour of winter’s first snowfall. Early meteorologists could, however, measure the speed and strength of falling rain. On Saturday, July 15, 1916, the Blue Ridge region saw more rain than anyone anywhere had ever seen since such records had been kept. One spot in Altapass, near Grandfather Mountain, measured more than 22 inches of rain in 24 hours.”


Hell and High Water: The Flood of 1916 | Our State
Four weeks after the 1916 flood in North Carolina, an even larger flood occurred in West Virginia.


Aug 10, 1916, page 1 – The Wheeling Intelligencer at Newspapers.com

Mar 19, 1925, page 22 – The Boston Globe at Newspapers.com

1916_base.gif (2078×1561)
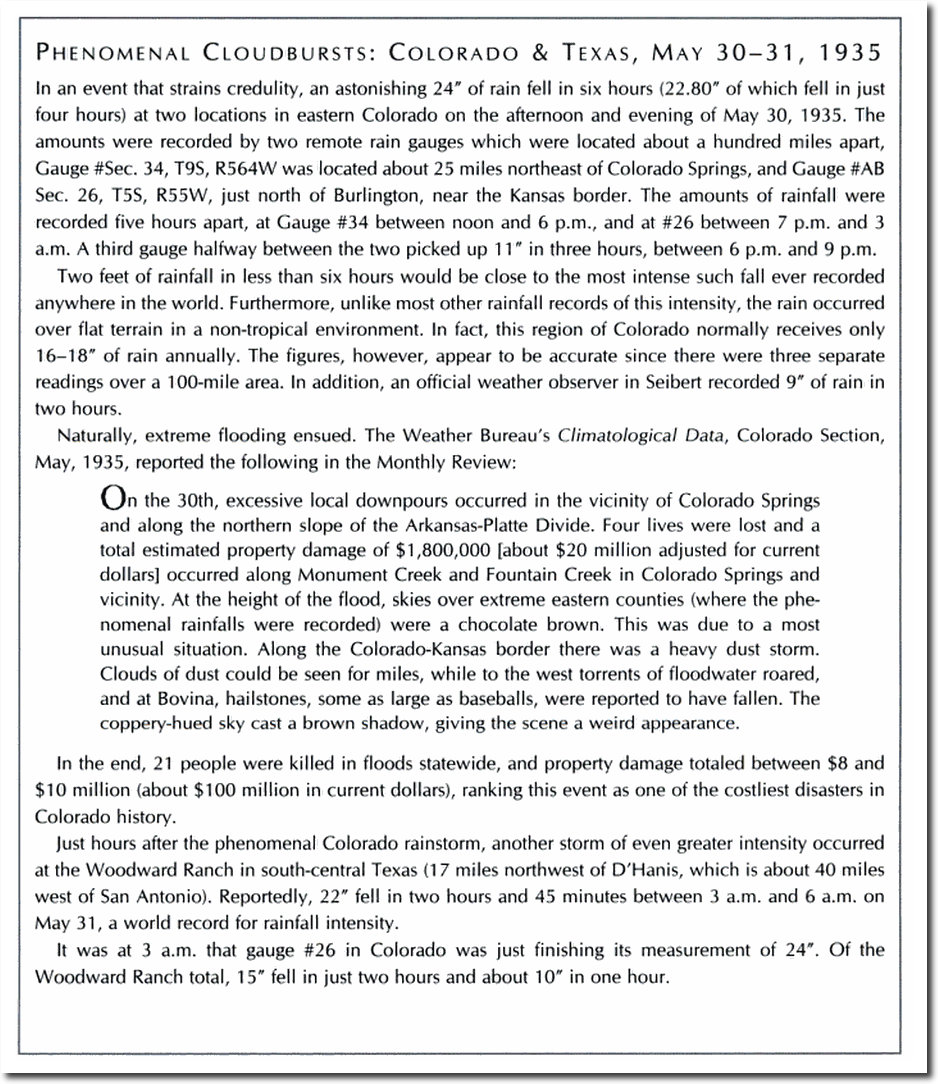
On May 30, 1935 two locations in Eastern Colorado received 24 inches of rain in six hours.

Extreme Weather: A Guide & Record Book – Christopher C. Burt – Google Books


