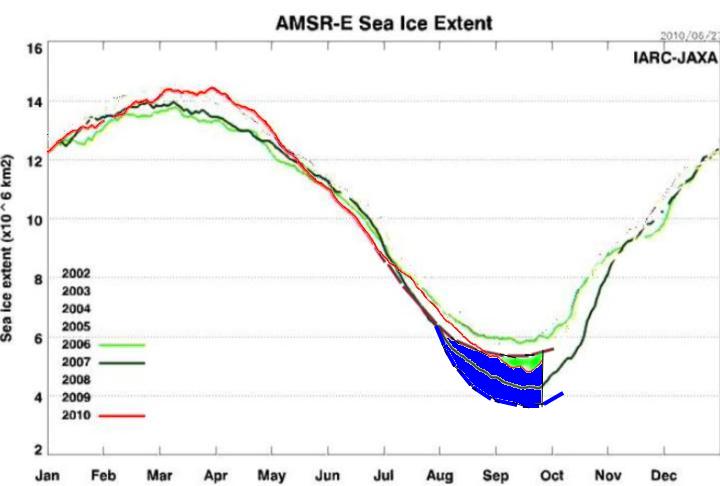
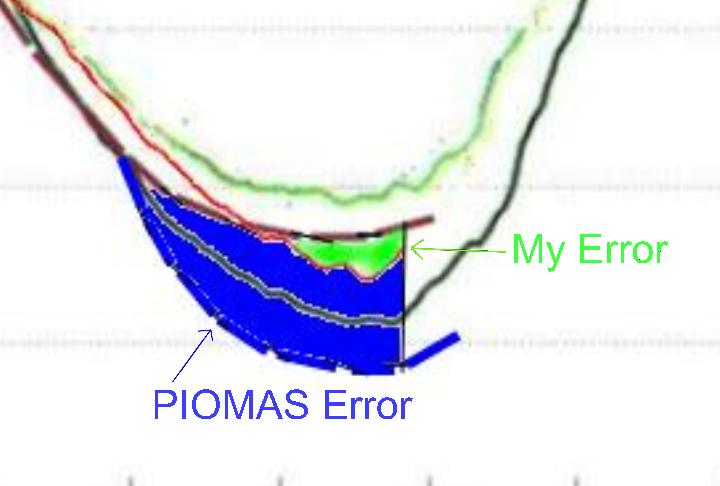
One of the readers yesterday asked how my forecast did compared with PIOMAS, which forecast a new record low of 3.7 million km².
The solid green area represents the error in my forecast, and the solid blue area represents the error in the PIOMAS forecast.


Oh yeah smarty pants? Let’s see you top this:
I predict that PIOMAS will predict a new all time low for 2011. So there!
“Never make predictions, especially about the future.”
~Yogi Berra
I believe that “Dr.” Berra was responsible for the hindcasting that has become so popular with the modeling crowd.
They were closer that you though 😉 Nice spin though, you must have taken a long time to come up with that way on showing you were more accurat. I guess the target diagram is now no longer in favour now you are further out?
Andy
Yea, they nailed that new record minimum, for the third year in a row.
Steve, I feel you are being disingenuous about the PIOMAS findings. First of all, YOU predicted an increase in ice extent by 500k km^2 over 2009. Following JAXA numbers that would have been a prediction of 5.75 M km^2 for 2010.
So let’s note that you overestimated 2010 by almost 1 M km^2.
PIOMAS predictions all the way showed a decline w.r.t. 2009 (which turned out to be correct) and their G1.0 (1 meter ice or less) predictions of 5.0 +/- 0.5 were not bad at all.
Now you used that very latest PIOMAS estimate, which was the most off (the 3.7 M km^2) to show your point that they were further off than you.
Also, comparing JAXA or NSIDC with PIOMASS is like comparing apples and oranges. PIOMASS uses the G1.0 (1 meter ice or less) of G0.4 (40cm ice or more) cut-off model which is best compared to ‘ice area’ instead of ‘ice extend’ in JAXA/NSIDC.
According to Arctic roos, ice area minimum in 2010 was 4.12 M km^2, which is very close to to PIOMAS’ 3.7 +/-0.3 prediction.
In the future, it would be nice if you would explain to your readers how PIOMAS calculates their ice extent, and be honest about your own definitions of ice extent in your own predictions, rather that pinger point at others when your own predictions turn out to be blatantly incorrect.
Thanks.
Also, do you have any predictions for 2011 minimum ? Or are you just going to continue to spin the stories from other people to make your ‘point’ ?
Rob,
1. That wasn’t my forecast for 2010.
2. As we have been seeing over the last four years, it all depends on the wind. Making a 2011 forecast now be little more than a WAG.
Steve,
1) Agreed, it wasn’t you prediction, it was Antony’s. Who also writes (on Feb.9) :
“Steven Goddard writes below that he agrees with the prediction I made in late 2009 that we’d see another 500,000 km2 of Arctic sea ice recovery in 2010.”
Do you no longer agree with how Anthony interpreted your statements ?
2) To melt ice, water temperature is much more important than wind, and you know that. Besides, if it were just the wind, then one might wonder how the winds can cause a steady decline of Arctic sea ice extend and volume over the past 30 year. With PIOMAS volume estimates on an accellerated decline over the past 5 years, which seems to indicate that Arctic Ice may simply completely desintegrate some summer in the next 10 years.
PIOMAS has forecast a record minimum three years in a row. In July, they forecast 3.8. Looks to me like they have some serious modeling issues.
Rob,
Since you like ROOS, please give me an analysis of the following graphs:
http://arctic-roos.org/observations/satellite-data/sea-ice/total-icearea-from-1978-2007
ROOS Data seems to not support the PIOMAS decline. A beautiful negative feedback though, you gotta love this planet.
Try looking at the system as a whole. You might learn something.