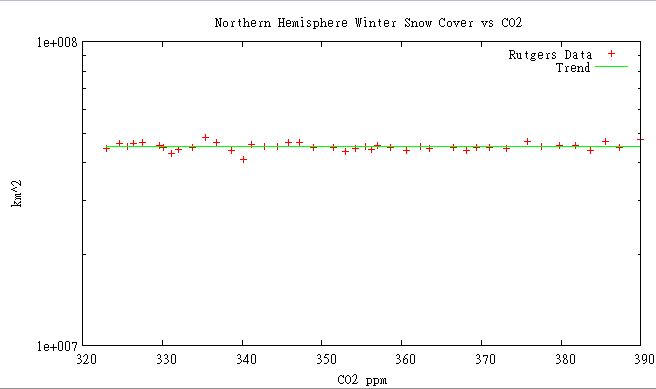
The graph above plots Rutgers Northern Hemisphere winter snow cover vs. atmospheric CO2. At first glance, it appears that there is no correlation between the two.
But we know that can’t be true, because leading experts from CRU told us a decade ago that due to global warming, snowfalls are now just a thing of the past.
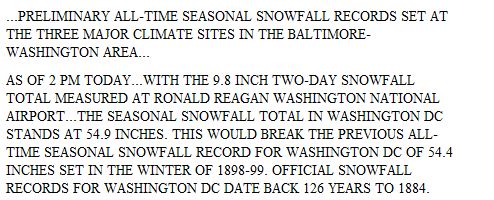
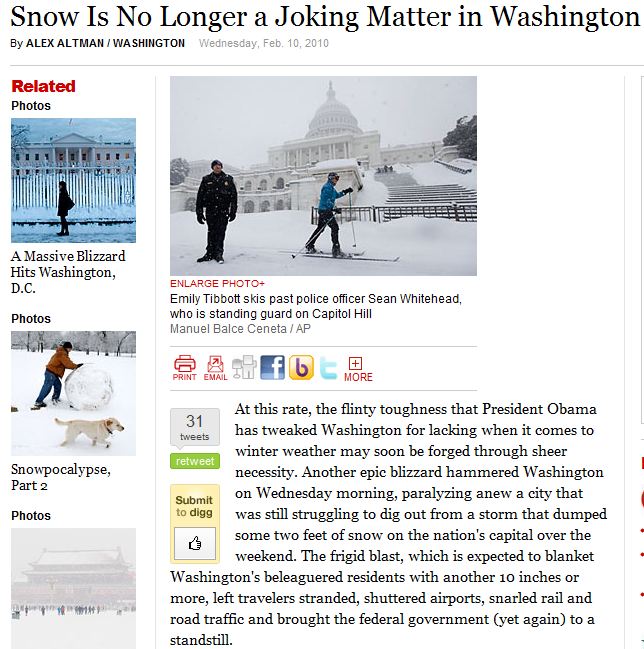
Even more confusing are obviously erroneous reports like these ones :
Whatever it is that person is skiing on is clearly not ordinary snow.
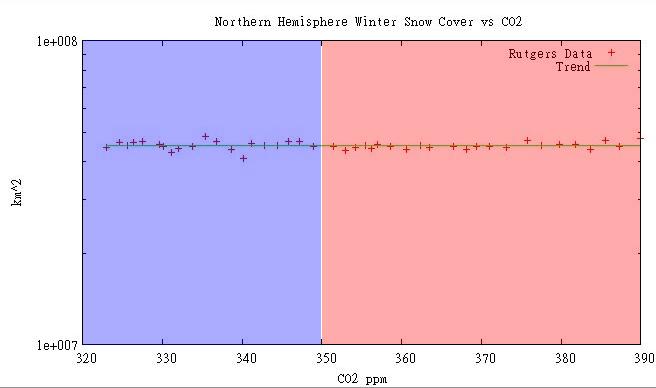
Dr. Hansen defines the safe CO2 level as something less than 350 ppm, so we are going to have to define two types of snow – cold snow and hot snow. The graph below shows this quite clearly. Cold snow prior to 350 ppm (formerly known as the year 1988) shown in blue, and hot snow (post 350 ppm) in red.
Leading climate expert Joe Romm explains it like this :
“These ‘snowpocalypses’ that have been going through DC and other extreme weather events are precisely what climate scientists have been predicting, fearing and anticipating because of global warming.”
So, when they said “children just aren’t going to know what snow is,” what they meant was that children will be playing in very heavy snow. I get it now.
There is no trend, no change in snowfall behaviour, nothing interesting happening – and yet the usual crew of suspects have deluded themselves into believing that they are seeing the end of the world.
Global climate disruption appears to have knocked a few people on the head a few times too many.
Reporting from the “hottest year ever.”
————————————————————————-
Here is the data used in the graph
323.04  44442349.67
324.62  46297133.67
325.68  45242413.67
326.32  46315551.00
327.45  46517476.67
329.68  45632660.67
330.17  44977140.33
331.08  42902865.33
332.05  44193418.00
333.78  44957337.67
335.41  48401983.00
336.78  46730553.33
338.68  43845123.67
340.11  40818640.67
341.22  45810383.33
342.84  45198443.67
344.41  45089016.33
345.87  46726720.33
347.19  46578984.00
348.98  44872522.00
351.45  44862964.00
352.9   43581924.67
354.16  44471979.67
355.48  45096895.67
356.27  44015979.67
356.95  45701485.00
358.64  44816110.67
360.62  43877959.67
362.36  45096536.33
363.47  44499508.67
366.5   44813952.33
368.14  43844289.67
369.4   44738855.00
371.07  45034486.67
373.17  44512401.67
375.78  46829439.00
377.52  45134885.33
379.76  45559808.00
381.85  45526618.67
383.71  43817340.00
385.57  46909030.33
387.35  45028342.00
390.00  47508592.33


I’ve lived in the DC/Baltimore area all my life, and that is some of the most idiotic cherry picking. The area has had wild swings between almost no snow and “dumpings” as long as I can remember. In 1977 the Chesapeake Bay froze over. We were stranded without power for days in the late 50’s and so on. Then there was the Knickerbocker storm in the twenties (no I wasn’t alive then but it would be brought up in the newspaper when we had a big storm). Snow happens.
The graph covers the northern hemisphere for the entire Rutgers global record. You are the one doing the cherry-picking.
Excuse me. I’m surprised that my comment was interpreted the way you did. I was attempting to support you’re post (and obviously failing). I was not referring to the overall post in my comment. I was referring to the “Snow is no longer a laughing matter in DC” and Romm’s statement. I thought that was clear from the context and from the fact I was only referring to the DC area. The comment I was making was attempting to show that large snow totals happen periodically in DC and have for a very long time and using that in support of AGW is nonsense.
Um, Barry, your statement entirely supports the conclusion from this post. Big snows happened before, big snows happen now. Dry spells happened before, dry spells happen now. That all turns into a big, fat, no significant trend result.
I believe that was the take-home point here.
-Scott
O/T but Julienne Stroeve replied to my post the other day and I have only just picked it up. (Been busy this week – my darling daughter is getting married next week!)
Julienne said ” I talked with some guys from the Coast Guard today (they have been operating in the Arctic since 1865) …….”
Don’t your guys retire at 65 like ours do in the UK?
Have a good weekend all!!