“There are claims coming from some communities that the Arctic sea ice is recovering, is getting thicker again,” Mark Serreze, director of the Colorado-based centre, told Postmedia News on Wednesday.
“That’s simply not the case. It’s continuing down in a death spiral.”
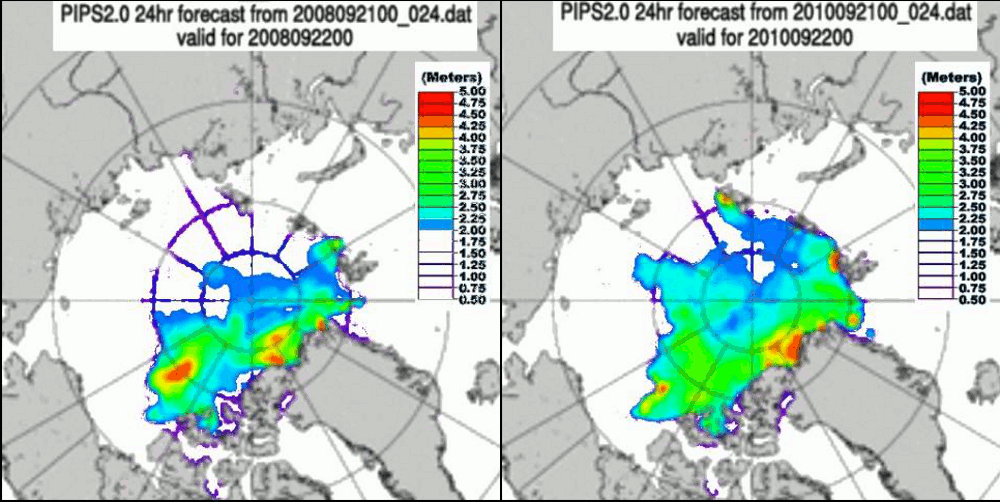
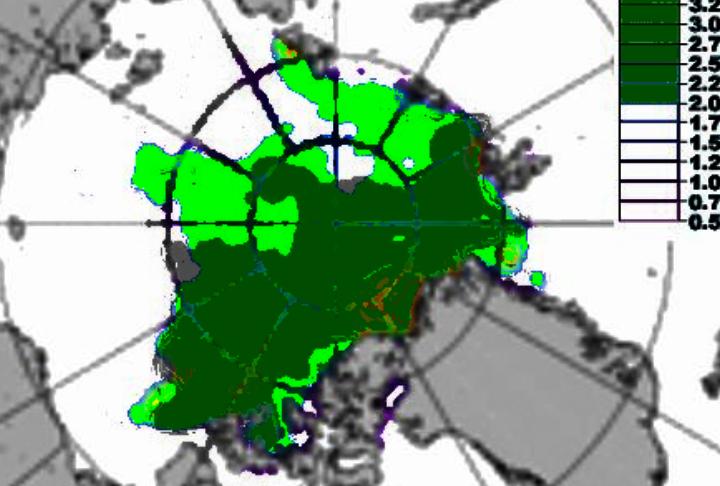
US Navy PIPS2 maps show that the area of Arctic ice greater than 2 metres thick has increased by about 50% since the same date in 2008. The blink comparator below removes all ice reported as less than two metres thick.
Light green shows expansion of 2 metre thick ice since 2008
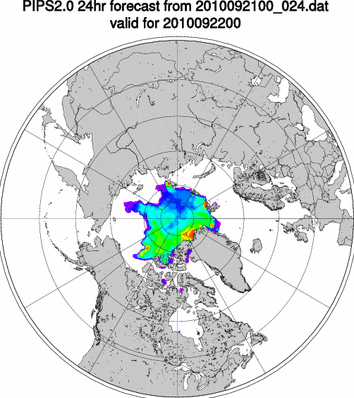
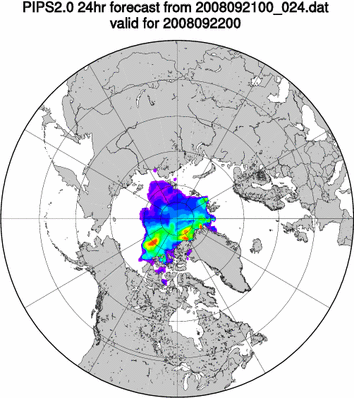
Original PIPS2 images are shown below.


got to hate it when facts get in the way of a good diatribe
So one model shows increased ice thickness, while another more modern one (PIOMAS) doesn’t. Big deal. How about we wait for the satellite data? Note that the folk at NSIDC have presumably seen some of the advance results from the new satellite already.
PIPS maps are updated daily, based on available observational data.
The *concentration* data is updated daily from SSM/I data. Thickness predictions are entirely model-derived, no actual thickness data is input at any stage.
I don’t think that is correct. They get thickness from submarine and buoy data.
For those interested, the paper describing the PIPS2 system is at http://ieeexplore.ieee.org/iel5/3183/9016/00399392.pdf
I highly recommend reading it – Steve’s description of how the model works are a little at odds with the paper!
Full publication details are:
Operational Use of SSM/I Ice Concentration in the
Initialization of a Coupled Ice-Ocean Model
P.G.Posey and R.H.Preller
This paper appears in: Geoscience and Remote Sensing Symposium, 1994. IGARSS ’94. Surface and Atmospheric Remote Sensing: Technologies, Data Analysis and Interpretation., International
Issue Date: 8-12 Aug. 1994
On page(s): 1231 – 1233 vol.2
Print ISBN: 0-7803-1497-2
INSPEC Accession Number: 5010377
Digital Object Identifier: 10.1109/IGARSS.1994.399392
You may have access to it directly via the link to the PDF (I had to use my University login), however any good library should be able to source it for you if not.
Steven: No, the updated model that integrates submarine and buoy data is (wait for it) PIOMAS. It’s what the A stands for – Modelling and Assimilation system, i.e. assimilation of other data sources.
PIOMAS showed very thin ice in the Beaufort Sea in April, where NSIDC showed MYI at the same time. Their summer forecast was way off the mark, particularly in the Eastern Arctic.
I have always found that PIPS thickness maps correlate well with NSIDC age maps.
It will be interesting to compare the new satellites values compared to PIPS and PIOMAS, can you do a compare when it comes out Steve?
Have to say I take both with a big pinch of (sea) salt at the moment as they don’t agree, so I feel better with extent as a measure, even though volume has more interest once a few years of accurate measurements can be built up.
Andy
PIPS consistently reports thicker ice than satellites, because the Navy is being conservative. They report based on the thickest ice in the region, so I don’t think you can do absolute comparisons vs. satellites without some sort of scaling.
I normally use PIPS thicknesses only for comparison vs. other PIPS maps.
I have one particular reader who will certainly enjoy your post. I’m surprised he hasn’t chimed in by now.
Serreze s getting his last crowing in while he can. Next year I doubt you’ll be hearing much from him.
He appeared on that silly NBC walrus junk story a couple days back.
NSIDC issue up-date : –
Update: 21 September 2010
Although ice extent appeared to reach a minimum on September 10, rising afterwards for three straight days, it has subsequently declined even further. NSIDC scientists are closely monitoring the ice extent and will provide another update on the data, as conditions develop.
Our season-end announcement in October will provide the final numbers for the minimum extent, as well as the monthly data for September, which scientists use for establishing long-term trends.
Ah isn’t PIPS used for Submarine usage, as in-where they can surface or not?
seems that needs to be accurate?
To quote Walt Meier, posting on WUWT:
http://wattsupwiththat.com/2010/07/13/nsidcs-dr-walt-meier-on-pips-vs-piomas/
In other words, the Navy uses it mainly for surface ships around the edge of the ice pack. If a submarine captain wants to surface, he or she would presumably use the submarine’s sonar, which would give much more direct data than any model 🙂
As for more general submarine usage, I’m finding it hard to envisage why they’d care about the difference between 1m ice and 5m ice when they can just pootle around at 20m depth and ignore it…
Peter,
As an ex-submariner (UK), I should like to point out that under-ice operations require a fairly accurate idea of how much ice is above you. Given that safe depth in a nuke boat is 60m, no boat is going to go pootling around at 20 metres – that is a recipe for big trouble. The reason we need to know the ice thickness is purely in the event of having to conduct an emergency surface amongst other things. Up to 1.8m thick you could probably ‘just’ get away it, but you would sustain damage, any more than that are we are talking serious damage or the inablility to surface at all. Unless you know something about submarine operations I suggest you adhere to a well know UK submarine saying “Shut and clip your lip”
Les,
Fascinating to hear from someone with direct experience! If you’re allowed to tell us: did you use PIPS2 forecasts (or some similar UK system perhaps)? How accurate were they?
All I can say is “Pip-pip Cheerio” to all that “unprecedented” melting.
Why is it getting to the point where we cannot rely on data sets in the first place?
Why is this info hard to obtain?
Do we have to fly up there ourselves to take measurements, or can we trust the scientists to give us direct undoctored information. It should be quite easy to tell if the sea ice is melting or expanding. Why is it that there is even debate? These are clues for those who have questions and for those who claim global warming is man made. So far the data has been proven to be man made…
If there is a polar bear in your living room you should be able to take a picture of it for all the world to see. If the polar bear is actually a penguin then the picture should easily show that too…and you should recognize it as such unless of course you have never seen a polar bear or a penguin or you try to call a polar bear a penguin and back it up with doctored data sets.
“Oh look! That penguin weighs a thousand pounds, it’s not a polar bear though…”
Consistently, when put to the test, the math for man made global warming comes up short. When supremely easy questions regarding the data are asked, ridiculously complex answers come back…if they come back. Many times FOIA’s go unanswered, because government agencies no longer have to answer to pesky citizens in the USA.
The temps are getting colder when the gathering devices are not left out next to AC exhaust, placed on concrete or asphalt or placed in jet exhaust pathways. Examining the raw data has led to finding temps above the boiling point of water that were averaged into the data instead of disregarded as faulty. Type the letters NOAA and the word “scandal” into your favorite search engine. Some posters here seem blissfully unaware that the data relied for “global warming” come “climate change” come “climate disruption” is flawed.
The data showing thickening should also be carefully examined but it is also verifiable. The fact that there is even debate should be a huge clue to all of you whatever “side” you choose. I’m on the side of mathematics not science and for dam sure not the global warming taxing scheme…set up by Goldman Sachs with the carbon taxes paid to whom again? But I digress.
The facts and figures and the data boils down to simple math when comparing year over year data without computer generated models. The ice is x thick in 2008 and y thick in 2010 the difference is either positive or negative. There is more or less. This is not complicated. It’s very simple math.
When ice reaches a certain thickness Submarines cannot break through it…therefore the data needs to be accurate. How is it that there are questions regarding this data? Why is it that there are questions regarding this data?
Cui bono?
Pingback: Arctic Ice Expanding And Thickening Contrary To Global Warmists « The Tonka Report
Let’s just posit that “Global Warming” was the EXCUSE to blow the WTC’s to curtail intercultural industry and trade, ‘for the world’s good’ by those who did it. It would be an obvious step after genocidal wars against South East Asia and Africa, et al. A decrease in CO2 production was “absolutely essential for our survival”, and we all know who the world’s richest and getting poorer fastest family is by name. And we know industry consumes natural resources and creates poisonous waste. And let us posit that this group of (PLACE WORD OF CHOICE HERE) blew the Gulf of Mexico well to create the condition of oil destroying the thermoclines to slow or stop the Atlantic Drift current so poor England (and Europe) wouldn’t ‘burn up from the resultant intense heat’.
After all, these folks pay sell-out quality scientists more than necessary to feed them data to fail in interpreting correctly and take blame for frequent mistakes. Check out the new black asphalt parking lots and industrial air-conditioners recently installed next to many of the tabulated weather station sensors. And note the defective readings from several satellites because of technical or human error. Who pays who?
The genius was bred out of these ruling families long ago. And whose spoor was left at the sites of each of these heinous acts?
And because of their land ownership and purchase of the use of the U.S. military through bribes, etc. they stand to control the world by keeping their ‘place on the throne’ through out, with starved people providing as slaves and sell-out security.
If S-510 goes through, America is indeed ruled by dumb sons of (PLACE YOUR WORD OF CHOICE HERE.) and traitors. The New World Order is not a world joined by one new currency with plenty of money for everybody. It is merely a return to the Old World Order of the British Empire, with George Bush’s and Dick Cheney’s heads up on the wall of Buckingham Palace as recompense for their loyalty to ‘merry olde England’. The Rockefellers darted from the fray long ago. They know their place. Cleaning up. The vultures of more business Hegellian dialectics than anyone alive today.True rulers of the shadows in the Western Hemisphere. Bush and the intelligence agencies are the work horse. They both lie repeatedly about the same things. And with a flourish indicative of a coked up teen-ager believing their own promo to enrapt paid hipster fools at their beckoned call.
TURN OFF YOUR TV SETS. THEY WANT TO RECOLONIZE YOU AND IF YOU DON”T BEAT THEM TO SELF -SUFFICIENCY, YOU WILL BE HOOKED UP TO A PLOW. CODEX ALIMENTARIUS IS COMING TO A DINNER TABLE NEAR YOU.
Probably starting with food banks and rich people who are competing bloodlines. If you are rich and have a child to sacrifice to Benny the Rat, that could be a ticket out.
But your kids will hate you for it. Starting today.
Right on Howard don’t forget about Obama and Clinton!
Al Gore who always wants to be first should open a nudist camp in the Artic and move in since the Artic is warmer than ever.
For Peter Ellis.
We didn’t use PIPS2. There was no UK system that I knew of (my job was what Americans called a “Radioman”) Besides as we all know what is forecast and what actually exists are two very different things. The UK Met office regularly get their forecasts wrong, which hacks me off no end especially as I sail regularly. Anyway, I digress. In polar regions we used to use an upward pointing echo sounder that would map the ice above us in much the same way that an echo sounder will map the bottom for you. After that it is merely a question of mathematics. Knowing your own depth and taking a reading from the echo sounder will give you the ice thickness. Simple stuff really. Additionally for under ice operations, the fin (or sail as you Americans call it) was especially strengthened to cope with punching through the ice. As a general rule, anything over 6ft in depth (1.85m) was just about the maximum we could surface through without incurring damage. I should add that we used to usually surface as close to the North Pole as possible. We used to do this in conjunction with a US nuke boat. Both crews would get out onto the ice pack where we would play cricket and the Americans would play baseball. We used to have armed sentries just in case any polar bear attempted a pitch invasion 🙂
Why don’t we just go to the NSIDC Website and read what they have to say?
“The 2010 minimum ice extent was the third-lowest recorded since 1979. The 2010 minimum ice extent was 37,000 square kilometers (14,000 square miles) above 2008; 470,000 square kilometers (181,000 square miles) above the record minimum in 2007; and 500,000 square kilometers (193,000 square miles) below 2009, previously the third lowest extent since 1979. The 2010 minimum ice extent was 2.11 million square kilometers (815,000 square miles) below the 1979 to 2000 average and 1.74 million square kilometers (672,000 square miles) below the 1979 to 2009 average.”
Formal announcement with a full analysis of the melt season will soon be published on this website.
Don’t forget, thin ice is fresh snow. The thicker ice which is thousands of years old is melting dramatically.
Here a Video which explains why it is cold in the winter despite the fact that the average temperature of our planet is rising rapidly.
Pingback: Arctic ice thickening « Follow The Money
People, people…
The NORSEX algorithm is a Brightness Index. SSM/I uses this algorithm as well. (More)
http://www.dcrs.dtu.dk/research/DCRS/projects/algorithm-report/node6.html
Again, it is only an approximation to THICKNESS. With GRACE operating in the 15-30% error range, we only have 15% and 30% concentration indicators with the Brightness Index. The ice could be 1 meter thick with a giant snow drift, or 50 meters thick with a footprint, the reflectivity will determine the “ice thickness”. Yes, you can proxy correlate, but too many other variables influence the measurement. Ever seen false echos on your local NEXRAD radar.
edit…
GRACE is not usable.