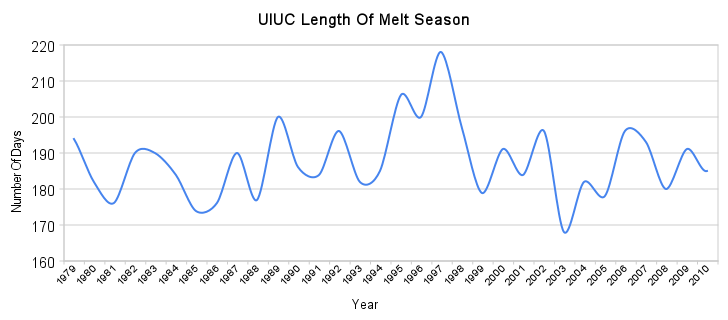
Following up on some work done by Roger Pielke Sr., I downloaded the UIUC Arctic data set and calculated the length of the melt season (date of minimum area minus date of maximum area) for each year of the satellite record.
There has been no long term change in the length of the melt season, though it is quite a bit shorter now than it was in the mid-1990s.
Mark Serreze at NSIDC wrote in 2008 :
“As the climate warms, the summer melt season lengthens …”
————————————————————————————————–
Here is the C++ code :
#include <string>
#include <vector>
#include <iostream>
#include <sstream>
#include <fstream>
#include <iomanip>

int
main(int argc, char** argv)
{
     std::string text_file_name = argv[1];
 std::ifstream* if_stream = new std::ifstream;
 if_stream->open(text_file_name.c_str(), std::ios::in);
 char line_string[256];
 int             current_year = 0;
 float           minimum;
 float           date_of_minimum;
 float           date_of_maximum;
 float           maximum;

 struct MinMax
 {
 int             year;
 float           date_of_minimum;
 float           date_of_maximum;
 int             length_of_melt_season;
 float           minimum;
 float           maximum;
 };

 std::vector<MinMax*>     min_max_vector;

 struct MinMax* current = (MinMax*)NULL;

 float           float_year;
 float           anomaly;
 float           area;
 float           norm;

 while ( if_stream->getline(line_string, 256) )
 {

 std::stringstream string_stream(line_string);
 string_stream >> float_year >> anomaly >> area >> norm;
 int year = int(float_year);
 float metric = area;
 float day_of_year = int ( ( float_year - float(year) ) * 365.25 );

 if (year != current_year)
 {
 if (current)
 {
 current->date_of_maximum = date_of_maximum;
 current->date_of_minimum = date_of_minimum;
 current->length_of_melt_season = date_of_minimum - date_of_maximum;
 current->minimum = minimum;
 current->maximum = maximum;
 min_max_vector.push_back(current);
 }

 current_year = year;
 current = new MinMax;
 current->year = year;
 minimum = (float)INT_MAX;
 maximum = (float)INT_MIN;
 }

 if (metric < minimum)
 {
 date_of_minimum = day_of_year;
 minimum = metric;
 }

 if (metric > maximum)
 {
 date_of_maximum = day_of_year;
 maximum = metric;
 }
 }

 current->date_of_maximum = date_of_maximum;
 current->date_of_minimum = date_of_minimum;
 current->length_of_melt_season = date_of_minimum - date_of_maximum;
 current->minimum = minimum;
 current->maximum = maximum;
 min_max_vector.push_back(current);

 size_t number_of_years = min_max_vector.size();

 for (size_t i = 0; i < number_of_years; i++)
 {
 current = min_max_vector[i];
 std::cout << current->year << "   " << current->length_of_melt_season << "    ";
 std::cout << current->maximum << "    " << current->minimum << "    ";
 std::cout << current->date_of_maximum << "    " << current->date_of_minimum << std::endl;
 }

 delete if_stream;
}


Another good data point! Too bad the record doesn’t go back before satellites.
Ya know, I was just thinking about doing this very plot today. Nicely done.
Thanks!
Roger Pielke Sr. had it up on his site at one time, but when he moved to WordPress the link to the graph quit working.
You should check what you have against this story:
http://www.physorg.com/news183836066.html
To see if the UUIC data shows what they claim or not.
from your link :
New NASA-led research shows that the melt season for Arctic sea ice has lengthened by an average of 20 days over the span of 28 years, or 6.4 days per decade.
Remember when NASA put men on the moon? Will that NASA come back some day?
How did you find that file? If you try to go to the next level up directory, you get their web site and I can’t see where if there is anything else there. Are there others hidden on that site such as the Antarctic? I also notice the data now goes through 2010 but the file name still shows 2008.
….it is quite a bit shorter now than it was in the mid-1990s….
Is it because of low solar activity, shifted PDO, and slight cooling in temperature?
A recent NASA study referenced here: http://earthobservatory.nasa.gov/IOTD/view.php?id=42456
claims the melt season is lengthening.
Because the do not use the max to min ice interval, but rather only the period of uninterrupted melting, their melt interval is much shorter, starting at about 110 days in 1979 and rising to 140 in 2007, their last record.
It is not clear imo whether the concept of a melt season is significant, given the long polar night, or whether the continuous melt period makes any overall difference.
Could it also be shortening in length because the farthest-south extents are now at higher latitudes than they were previously? These areas would have less days of possible sunlight (and less total irradiance).
If that’s the case, even if AGW is true it’ll be harder to melt all the ice than people predict.
-Scott
Don’t know if you use R or not, but here is the code to do the same in R that you did in C++, in case anyone wants it. Just wanted to see how it could be done in R.
file.handle <- "http://arctic.atmos.uiuc.edu/cryosphere/timeseries.anom.1979-2008"
ice <- read.table(file.handle)
names(ice)<-c("date", "anom", "area", "norm")
# strip out the years in the data
iceyear <- floor(ice$date)
#convert the fractional year to a day of year
iceday <- round(365.25*(ice$date - iceyear))
# create dates from the year and day
iceyrday <- strptime(paste(iceyear,iceday, sep = ":"), format = "%Y:%j")
# add the year as a factor and the date to the ice data.frame
ice <- cbind(as.factor(iceyear), iceyrday, ice)
#name the columns
names(ice) yearstart
# do a similar calc on the index of the minimum and maximums of each year
# adding the first index of the year to the index from the start of the year
as.numeric(by(ice$area, ice$year, which.min ))+yearstart-> yrminindexes
as.numeric(by(ice$area, ice$year, which.max ))+yearstart-> yrmaxindexs
# now get the time differences for all the years
as.numeric(difftime(ice$date[yrminindexes], ice$date[yrmaxindexs]))->melttime
plot(years, melttime, xlim =c(years[1], years[length(years)]), type = "l", col = "blue", lwd = 3)