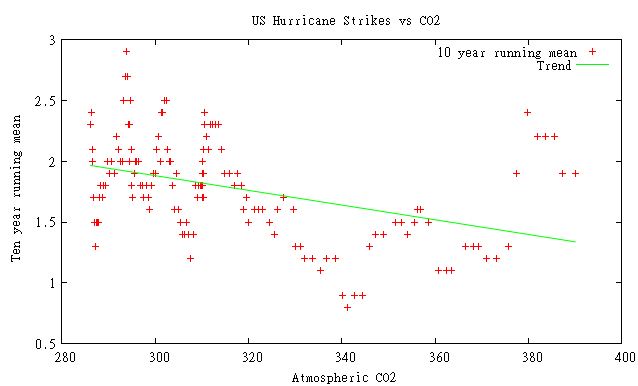
The graph above plots the ten year running mean of US hurricane strikes vs. atmospheric CO2. As you can see, there is no correlation between increasing CO2 and increasing hurricane strikes.
Here is the data :
286.2	2.3
286.4	2.4
286.5	2.1
286.6	2
286.8	1.7
286.9	1.7
287	1.5
287.1	1.5
287.2	1.3
287.4	1.5
287.5	1.5
287.7	1.5
287.9	1.5
288.1	1.7
288.4	1.8
288.7	1.7
289	1.8
289.4	1.8
289.8	2
290.2	1.9
290.7	2
291.2	1.9
291.7	2.2
292.1	2.1
292.6	2
293	2
293.3	2.5
293.6	2.7
293.8	2.9
294	2.7
294.2	2.3
294.3	2.3
294.5	2
294.6	2.3
294.7	2.5
294.8	2.5
294.9	2.1
295	1.8
295.2	1.7
295.5	1.9
295.8	2
296.1	2
296.5	2
296.8	1.8
297.2	1.8
297.6	1.7
298.1	1.8
298.5	1.7
298.9	1.6
299.3	1.8
299.7	1.9
300.1	1.9
300.4	2.1
300.8	2.2
301.1	2
301.4	2.4
301.7	2.4
302.1	2.5
302.4	2.5
302.7	2.1
303	2
303.4	2
303.8	1.8
304.1	1.6
304.5	1.9
305	1.6
305.4	1.5
305.8	1.4
306.3	1.4
306.8	1.5
307.2	1.4
307.7	1.2
308.2	1.4
308.6	1.8
309	1.7
309.4	1.8
309.8	1.8
310	1.8
310.2	1.8
310.3	1.7
310.4	1.9
310.4	2.1
310.3	2.1
310.2	1.7
310.1	1.8
310.1	1.9
310.1	1.7
310.2	2
310.3	2.1
310.5	2.3
310.7	2.4
311.1	2.2
311.5	2.1
311.9	2.3
312.4	2.3
313	2.3
313.6	2.3
314.2	2.1
314.9	1.9
315.98	1.9
316.91	1.8
317.64	1.9
318.45	1.8
318.99	1.6
319.62	1.7
320.04	1.5
321.38	1.6
322.16	1.6
323.04	1.6
324.62	1.5
325.68	1.4
326.32	1.6
327.45	1.7
329.68	1.6
330.17	1.3
331.08	1.3
332.05	1.2
333.78	1.2
335.41	1.1
336.78	1.2
338.68	1.2
340.11	0.9
341.22	0.8
342.84	0.9
344.41	0.9
345.87	1.3
347.19	1.4
348.98	1.4
351.45	1.5
352.9	1.5
354.16	1.4
355.48	1.5
356.27	1.6
356.95	1.6
358.64	1.5
360.62	1.1
362.36	1.1
363.47	1.1
366.5	1.3
368.14	1.3
369.4	1.3
371.07	1.2
373.17	1.2
375.78	1.3
377.52	1.9
379.76	2.4
381.85	2.2
383.71	2.2
385.57	2.2
387.35	1.9
390	1.9


Au contraire…..according to previously well established principles of climate impact reporting (IPCC style) there is clearly a definite possibility that increasing [CO2] might have a significant effect….in the negative sense.
Oh, dear! I’m worse than I thought…