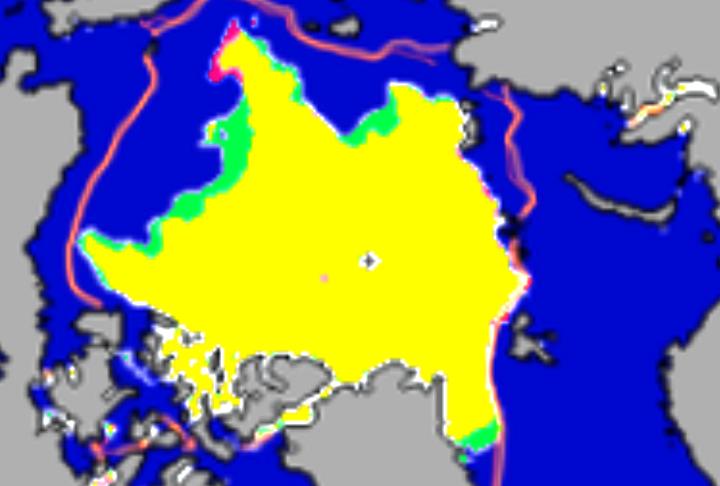
Areas in green show where the ice edge has grown since September 20. Areas in red show ice loss.
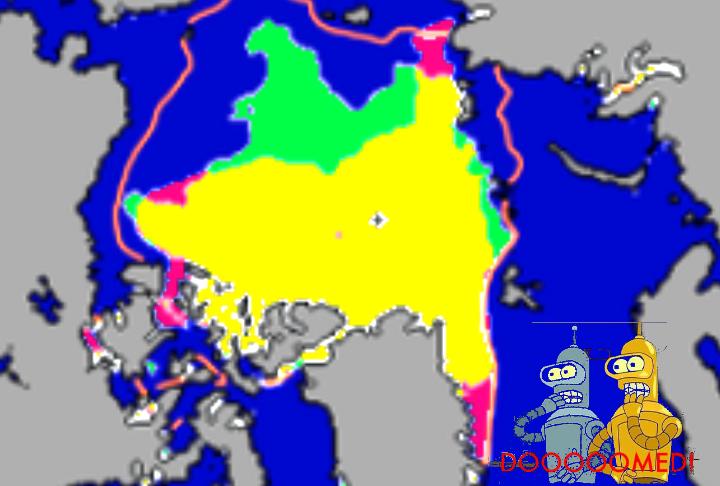
The next map shows areas of ice gain since the same date in 2007. Note that there is less “doomed” ice this year in the Greenland Sea. All ice in the Greenland Sea melts within a few months.


Good grief…in 2008 and 2009 you were trying to convince us that you correctly predicted a “recovery” of the ice. This year you predicted “continued recovery” with a minimum of 5.5 M km^2…and we got 4.8 M km^2 (according to JAXA). Time to ‘fess up. All this new stuff formed since the minimum, which you show on the top map in green, we have a name for. This name which will apply to this ice until September 2011, you are not going to like.
First year ice!
My June estimate had 13% error. The PIOMAS June estimate had 17% error.
Uh, no, the June estimate of PIOMAS is represented by “Zhang” at
http://www.arcus.org/search/seaiceoutlook/2010/june
It was 4.7 M km^2. This is only a 2% error, not 17%!
http://psc.apl.washington.edu/lindsay/September_ice_extent.html
Lindsay, as in “Lindsay and Zhang”
Quite a fast growth of first year ice.