[youtube=http://www.youtube.com/watch?v=Sx2PAHDtrAo]
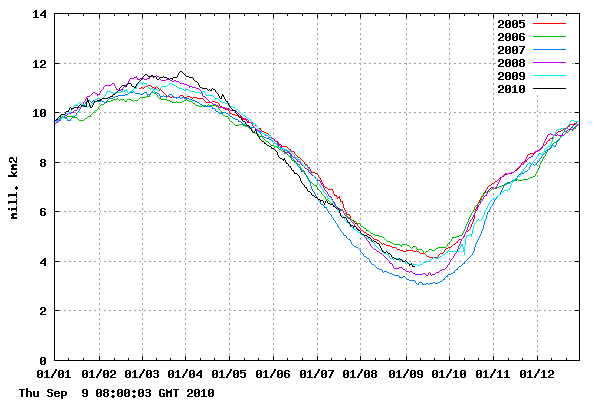
Since mid-August, southerly winds have been pushing the edge of the Arctic ice back towards the North Pole. This is very similar to the pattern from the last El Niño year of 2007.
http://ocean.dmi.dk/arctic/icecover.uk.php
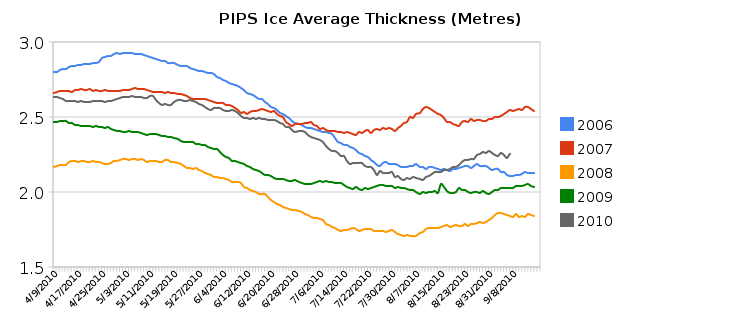
The graph below shows average ice thickness calculated from PIPS maps. As the ice has compressed towards the pole, the average thickness has increased, and is now the highest since 2007.
I wrote this in the June 6 Arctic Ice News, and that is exactly what has been happening.
Conclusion : Based on current ice thickness, we should expect September extent/area to come in near the top of the JAXA rankings (near 2003 and 2006.) However, unusual weather conditions like those from the summer of 2007 could dramatically change this.
–
In 2007, much of the actual ice loss occurred during the following winter, when thick multi-year ice blew out into the North Atlantic and melted. Let’s see what this winter brings.


It will also be interesting to see what Cryosat says about thickness. Your PIPS2 analysis, while interesting, is a bit of a self-fultilling prophecy. Historically, winds have tended to compact ice, so that’s what gets built into the models like PIPS. Then, when the winds blow again, naturally the model will assume that the thickness also builds up – key word: assume.
However, it’s important to keep in mind the physical reality of how the thickening happens. Winds don’t magically make ice thicker by themselves, they make ice thicker because they blow the floes up against an immovable barrier, making them override one another and thicken the pack. That necessitates two things: a barrier to the free flow of ice, and ice of sufficient concentration that it over-rides rather than just narrowing gaps between adjacent floes.
That was the point behind my pointing at the Svalbard area the other day – the PIPS2 modelling is contradicted by the actual photos from the area which show that ice is not being compressed against the coastline in sufficient concentration to cause overriding/ridging/thickening. Yes, the Cryosphere Today and Bremen maps show (a little) increase in concentration, but until it gets near 100% the ice won’t start piling up into a thicker layer.
Turning to the other major area of thickness modelled by PIPS2, north of the Canadian Archipelago – here the situation is somewhat better since the concentration is indeed near 100% by all measures. However, the other necessary factor – an impassable barrier to compress the ice against – is less present than in future years. The ice bridges between adjacent islands have melted out. Far from piling up, the older, thicker ice in the region is streaming between the islands into the Archipelago and melting out there. This, by the way, is why there’s been no announcement of opening of the NW passage – it’s not that the ice isn’t melting out, it’s that more ice is constantly shunting into it through straits that are normally frozen solid. All that ice represents net loss within the central basin.
So: be wary of models, and wait for real data from the satellite. It’s likely to show extensive loss of volume even relative to 2007.
Peter Ellis says:
I fully agree and have noted that with the extent not living up to the sceptics hope, other diversions are starting to come into play. Compacting and spreading of ice are natural occurrences and not exclusive or remarkable for 2010. If weather patterns hadn’t changed for a consistent period after the 2010 fast initial melt, we may well have seen an extent below 2007 today. I live up to my pseudonym when I say that I am baffled by the sceptics claim of increased ice volume, when it clearly does not match the present arctic behaviour. I suppose that the ‘arctic recovered’ claim is now well and truly debunked by 2010 and that Cryosat2 will soon debunk the volume claim.
Peter and baffled24, while the summer circulation pattern this year was not as favorable for ice loss as in 2007 and 2008, the dipole anomaly pattern did set up in June and August which helped to compress the ice towards the pole. However, I do believe that the continued fast pace of ice loss observed thus far in September (twice that of climatology and faster than in 2007 and 2009) reflects thin ice. In 2008 we saw continued rapid ice loss through August and early September that appeared to be largely a result of the ice running out of thickness. All the old ice that was transported into the Chukchi over this past winter has disappeared and about 50% of the old ice in the Beaufort disappeared. Arctic-wide there has been a 60% reduction in the oldest, thickest ice (5+ years old) between the end of April and the end of August.
Julienne,
Calculated over the entire Arctic, do you expect an increase or decrease in MYI in spring 2011 relative to spring 2010?
How much of the ice loss in the Chukchi and Beaufort Seas was caused by the ice being blown to the north – rather than melting?
Julienne,
I would expect that thin ice is more easily blown than thick ice. If it’s blowing North, then it’s compacting, and blowing South out of the Arctic, melting. So I guess the question is: Which way is the ice blowing?
Steve,
From looking at satellite imagery, it appears that thicker ice gets blown more easily. This would make sense, since thicker ice presents more surface area perpendicular to the wind direction.
ok Steven, I can see that. I guess the more important point:
If it’s moving North, it’s not melting, but compacting. Or are warm winds blowing out of Russia to melt the ice?
A couple of observations:
First, the ice melt in the Beaufort, Chukchi, and East Siberian seas has been showing a pattern. The thickest oldest ice had rotated in the Beaufort Gyre last winter/spring and by early June was located at southern latitudes where in recent years the ice has melted out. So the large loss in 4+ MY ice (60%) this year that Ms. Stroeve mentions in her post makes a lot of sense. Since there was first and second year ice to the north of this ice in the ice pack, the wind couldn’t blow this ice into the ice pack very easily, as Mr. Goddard surmises… the MY ice melted out.
Second, the loss of extent so far in September seems to be ice either in or adjoining the Beaufort, Chukchi, and East Siberian seas, with some loss in the Laptev and the adjoining area of the Arctic Basin. It seems that after the buttress of MY ice melted out, the 1st and 2nd year ice behind it is melting out now in September. There still is a considerable amount of ice in the East Siberian and adjoining Arctic Basin below the 80N parallel that could still melt out this year, so the September melt isn’t over yet… in most years the melt should slow dramatically by now.
Third, the pattern of the melt out in the areas mentioned above is interesting. As Mr. Goddard has pointed out, the ice concentration behind the edge of the ice pack seems to be dropping, due to either melt out by thermal energy from warm winds or by warmer than normal Arctic ocean waters circulating under the ice pack, followed by a relatively quick collapse of ice extent in these areas. This is showing up as 4-5 days of leveling ice extent, followed by the quick loss of several hundred thousand sq km in just a few days. This seems to indicate that the mechanism for losing ice extent in late August and September has changed somewhat from previous years. Not even 2007 seems to show the thinner ice collapses that this years seems to be showing up this year. We may still see the JAXA ice extent fall below 4.8 sq km, unless the weather changes fast.
Correction to my comment: JAXA ice extent could still fall below 4.8 million square km…
But is there really so much compaction going on at the moment? Especially in relation to other years.
A few weeks ago I devised a very crude and amateurish method to ascertain what I believe they call ‘compactness’. I used Cryosphere Today area data and IJIS extent data and divided the one by the other. The percentage is a crude indicator of whether ice is converging (high percentage) or spreading out (low percentage).
As you can see on my latest graph the percentage is currently relatively low, lower than all other years from 2006 to 2010. I think I can see this confirmed on MODIS satellite images and sea ice concentration maps by CT and Uni Bremen. Whereas there seems to be compaction on the Pacific side of the Arctic (where a lot of the multi-year ice is), the ice looks like it is spreading out a lot on the other side.
One of the commenters on my blog, L. Hamilton, used NSIDC extent and area numbers to show compactness on a monthly basis, like here in my follow-up post.
Ms. Stroeve… Yet another question for you:
This year the Bremen ice map shows a consistent polynya opened up at around 87N to 88N and 165W. The polynya seems to be an area about 50 miles in diameter with less than 15% ice concentration, with surrounding ice pack showing 10-50 miles of surrounding ice at less than 60% concentration.
Have we seen large openings like this in the ice pack above 85N before, in the satellite record? I can’t recall seeing anything like this in the last four years.