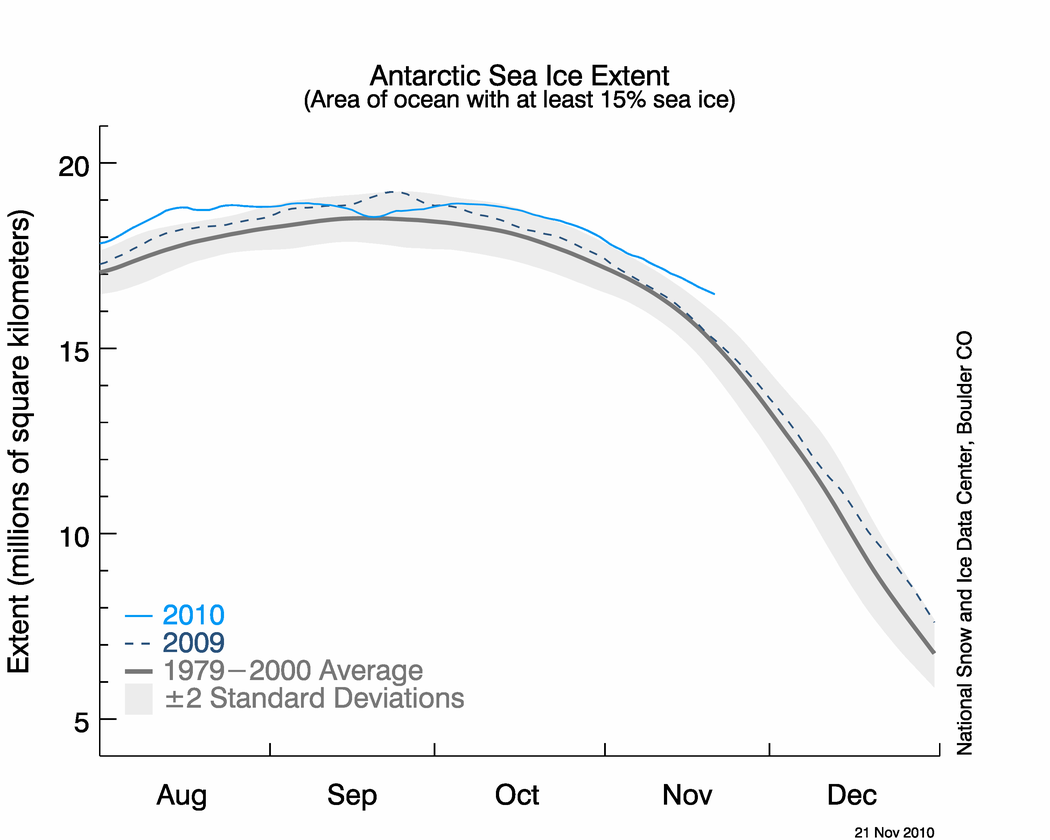
The Sun is up high in the sky over Antarctica and sea ice extent is far above normal. The extra ice reflects sunlight back into space, which has the effect of a positive feedback, reinforcing the extreme cold which the Antarctic is experiencing this spring.
The ice is melting very slowly, because of the cold temperatures.
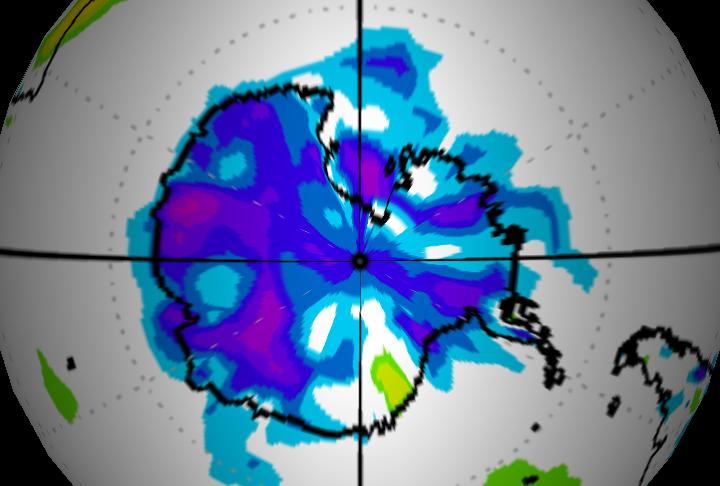
NOAA anomalies in degrees C.


Is that big red spot at the top of the map the fake figures where no satellite coverage is to help it make it the hottest year ever?
NCEP data appears to come from NOAA, which makes it surface stations. Satellite data isn’t “faked”, but it can be “adjusted”.
isn’t “faked”, but it can be “adjusted”.
I knew a girl that had fake, I mean, adjusted breasts.
;O)
Steven may have spilled some ketchup.
One of the minor things that I would change if I were Emperor is the far-too-common usage of Mercator projections for displaying global climate info. Pumpernickle, you comment on “that big red spot” and my first reaction is “Big compared to what?” Unfortunately, I can’t tell! That darned map projection gives enormous magnification to the poles — both North and South — and my gut response is to perceive, as you say, a “big red spot.” Is anyone aware of the same global temp info projected onto something that more closely approximates an equal area map, one that does not entail so much distortion of sizes?
http://www.sciencedaily.com/releases/2008/06/080625140649.htm
BTW the Gakkel ridge in the Arctic is very interesting, as we know that increased seismic activity on the East Pacific rise has connections to El Nino. Gakkel ridge has been pretty active of late, with underwater pyroclastic flows documented.
Did Sarah Palin say she could see South Pole ice from North Pole ice?
;O)
North Pole ice heading one way
http://nsidc.org/data/seaice_index/images/daily_images/N_timeseries.png
South Pole ice the other.
Balance.
Reminds me of a cool video I saw in Berkeley at an animation festival, though it’s off topic, it’s interesting to see:
http://www.youtube.com/watch?v=3vpmuMHor6Q
Basic geology, Arctic and Antarctica always balance each other, it’s how the planet works. If one grows, the other melts
SP:
Not always as the Glacial Maximum periods show but the poles are not in sync with one following the other by a few thousand years. This is probably easiest seen comparing the ice cores from Greenland and those from Antarctica.
The warmists always try to make us look at the north pole, telling us that the ice will disappear next summer, or the year after, or…..where the ice is refusing to melt in summer according to their wishes. (This is only one of a long list of wishes which are refusing to materialise). Antarctic ice, which was supposed to start melting by now, has obviously took a turn towards the way that the warmists don’t like, hence they have to try to avoid the issue, somehow.
AGW melted and reformed into CACG which melted and has now been reformed into GCD (global climate disruption) which s already melting. All warmist propoganda is bound to melt into nothingness, but the ice seems to be holding pretty well, which means, according to my physics, that the planet is not warming, which is the bottom line of the warmists’ list of failed wishes.
But then we may all die due to ocean acidification…………or (G.O.D.) Global Oxygen Depletion……or old age.
WiFi is bad too now, like electricity
http://www.pcworld.com/article/211219/study_says_wifi_makes_trees_sick.html?tk=rss_news
Wifi is just another frequency that is being used to broadcast information at low energy levels. For a frequency being broadcast at high energy levels look at AM FM UHF and VHF, Or Radio and TV signals.
I saw this article as well. Don’t know about wifi but I have read that solar minimums can have an effect on tree growth and I have noticed a marked difference in the behaviour of the trees in my area as well as 900 miles away where my mother lives. This Fall the trees dropped their leaves in an unusual fashion and it seems the softer woods were most effected. My red maples never did turn red, the leaves turned brown and fell early. The same thing happened to the cottonwoods and poplars. Oaks seemed to have fared the best. And I am not alone in this observation, I have heard others describe the same behaviour in their trees. Weird.
Steven:
Normal should be a range of conditions experienced over a period of time determined by the average length of the regional long term weather patterns. Also referred to as cycles or Oscillations. Normal equates weather conditions to a static pattern and average is not much better. Depending on wind conditions you could have a couple of Million km sq difference in ice extent on a given day and still be in the normal range for that day, week, or month
I think it will get back to average pretty quickly and be in agreement with other sources soon.
Andy
Pingback: Never Let Facts Interfere With Good Disaster Scare. | Greenhouse Bullcrap
Pingback: global warming - unrestricted discussion - Page 290 - Stormfront